Browse Library
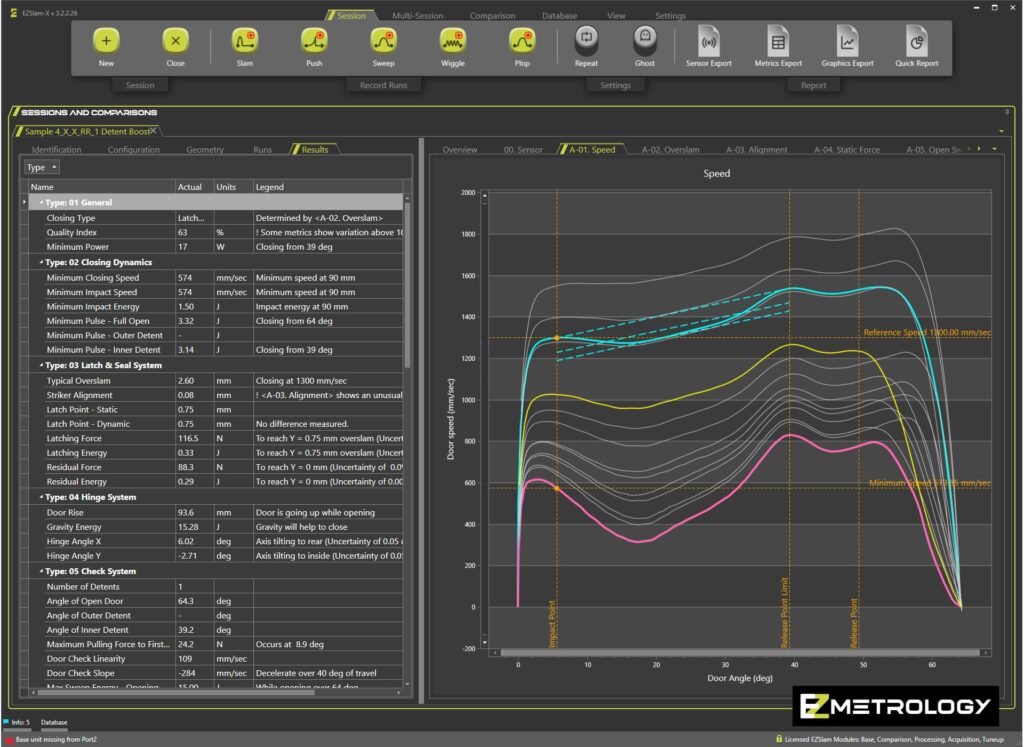
EZSlamX Software Speed Trend Graph with Table
Screenshot of EZSlamX software with trend graphs and table for analysis of door closing speed
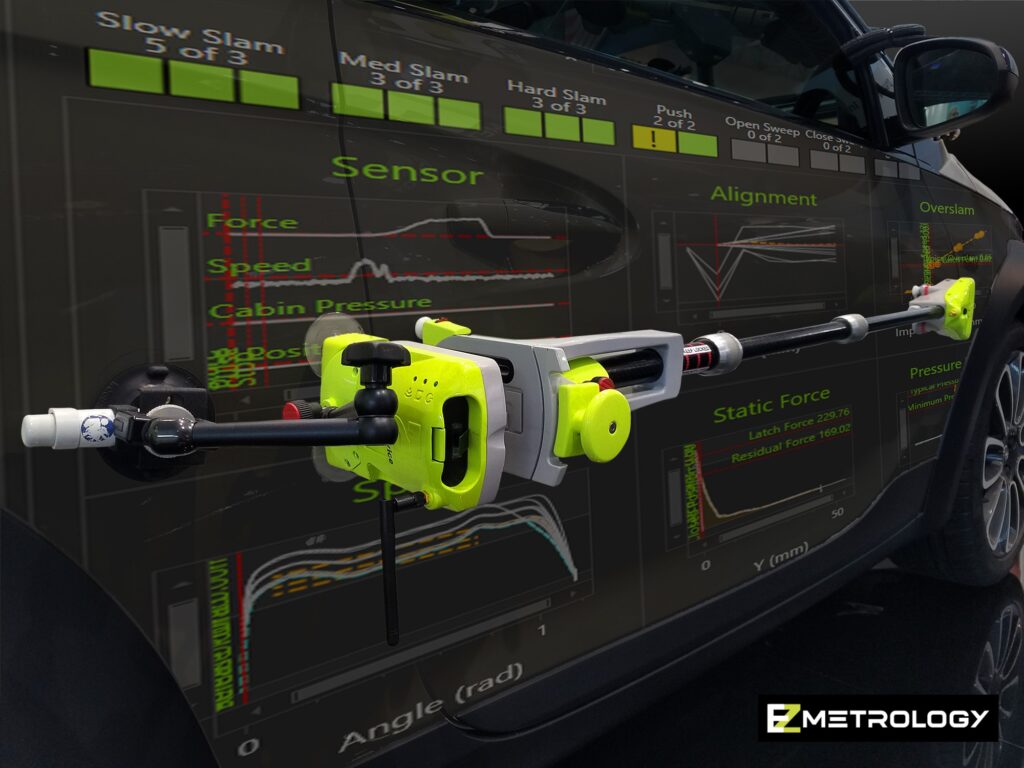
EZSlam with Graphing on Car
EZSlam mounted on a door with graphics superimposed on car door and body panels
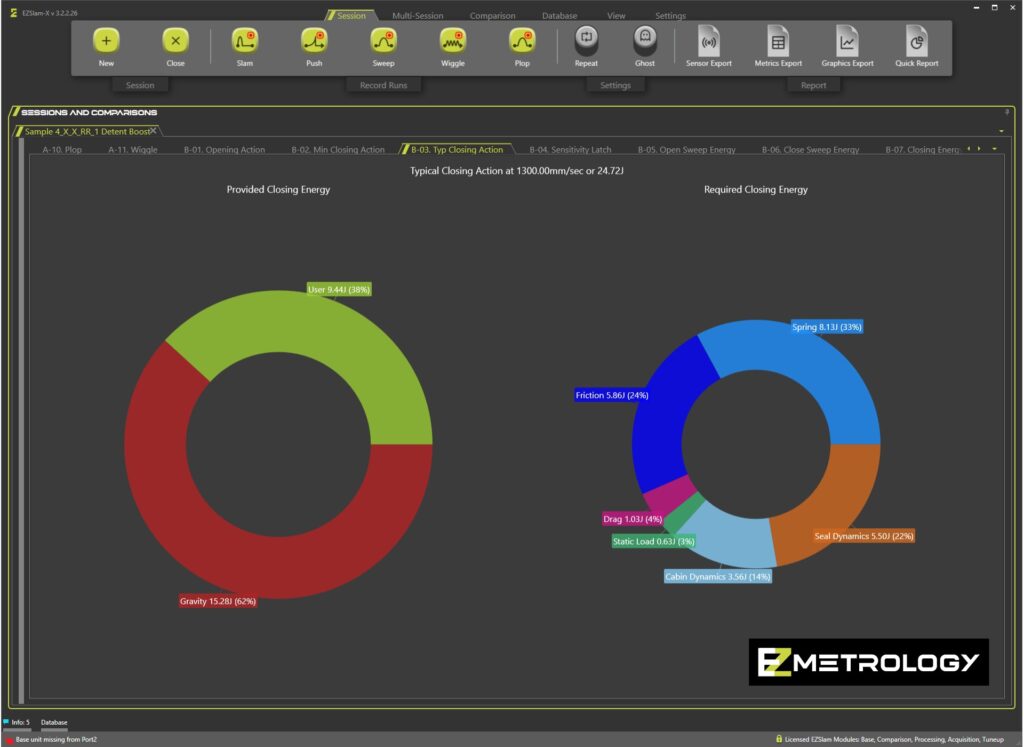
EZSlamX Software Energy Pie Charts
Screenshot of EZSlamX Software demonstrating door closing energy distribution and analysis with pie charts

Lamborghini with SpeedPod EZSlam EZMotion Drive
Lamborghini with SpeedPod EZSlam and EZMotion mounted

SpeedBay Logo Green
SpeedBay product logo green

SpeedBay Logo White
SpeedBay product logo white

SpeedBay Logo Black
SpeedBay product logo black

MyPod Logo White Border
MyPod product logo white

MyPod Logo
MyPod product logo

EZSlam Logo Black
EZSlam product logo black

EZSlam Logo White
EZSlam product logo white

EZSlam DoorKit Audit Detailed Comparison
Product overview specifications and functionalities for EZSlam and Audit

Traceability Charts
Certification and Tracability for EZMetrology Devices

EZSlam Slope Effect
Address effects of inclionation during opening and closing actions for EZSlam
EZSlamX Energy Models
Explanation of EZSlam Energy Models including pie graphs flush sensitivity and energy buildup
