Browse Library
22 posts found
![](https://portal.ezmetrology.com/wp-content/uploads/MEIP20002-Audit-Screen-Pressure-Transient-Curve_TH-1024x559.jpg)
Audit Screen Pressure Transient Curve
Screenshot of pressure transient curve for Audit software
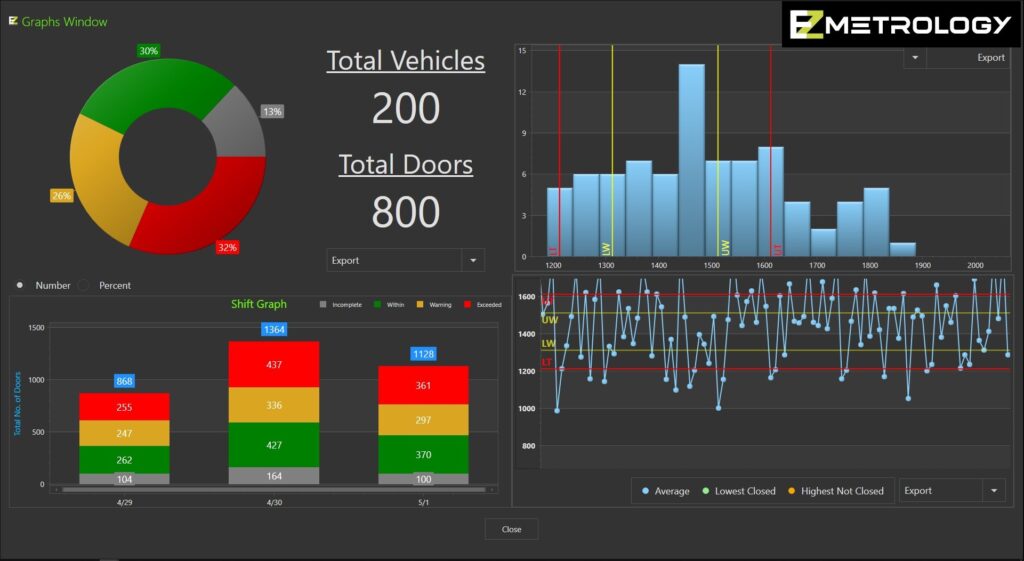
![](https://portal.ezmetrology.com/wp-content/uploads/MEIP14003-PLS-Graphs-Screen_TH-1024x561.jpg)
PLS Graphs Screen
Screenshot of graphs screen for PLS software
![](https://portal.ezmetrology.com/wp-content/uploads/MEIP14001-PLS-Flat-Screen-Offset-with-EZM-Logo_TH-1024x640.jpg)
PLS Flat Screen Offset with EZM Logo
Image of PLS used with EZSpeed on truck production line
![](https://portal.ezmetrology.com/wp-content/uploads/MEIP01007-EZSlamX-Software-Screenshot-of-Cabin-Pressure-Transient_TH-1024x576.jpg)
EZSlamX Software Screenshot of Cabin Pressure Transient
Screenshot of EZSlamX software illustrating sample measurement of door cabin pressure as car door is closed and cabin release valve opens
![](https://portal.ezmetrology.com/wp-content/uploads/MEIP01008-EZSlamX-Software-Close-Sweep-Force_TH-1024x626.jpg)
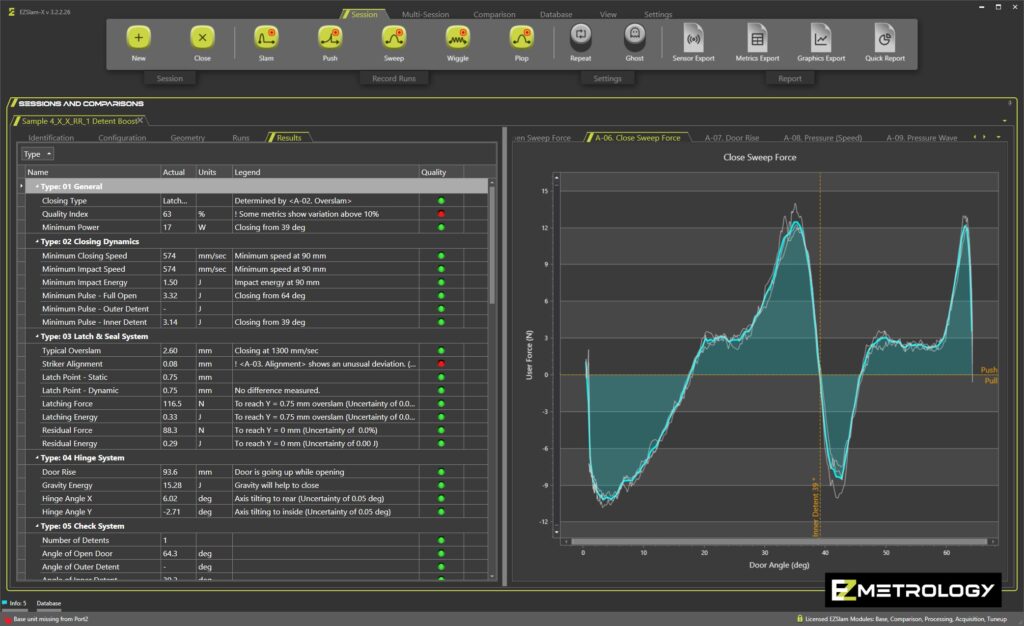
EZSlamX Software Close Sweep Force
Screenshot of EZSlamX software showing graphs for door closing sweep force
![](https://portal.ezmetrology.com/wp-content/uploads/MEIP01005-EZSlamX-Software-Speed-Trend-Charts-Only_TH-1024x626.jpg)
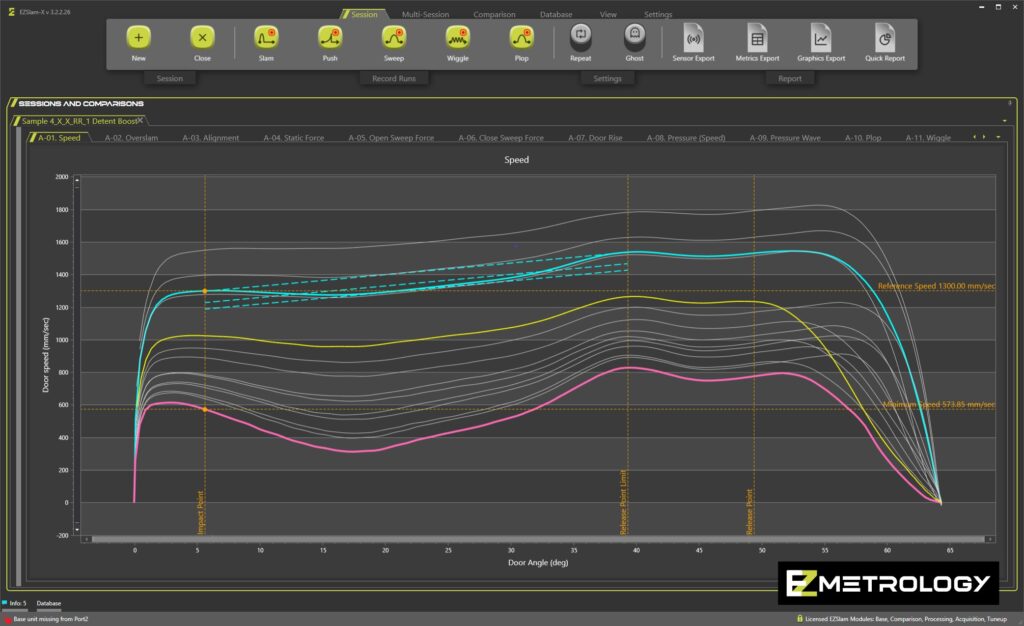
EZSlamX Software Speed Trend Charts Only
Screenshot of EZSlamX software showing trend charts for door closing speed analysis
![](https://portal.ezmetrology.com/wp-content/uploads/MEIP01006-EZSlamX-Software-Speed-Trend-Graph-with-Table_TH-1024x747.jpg)
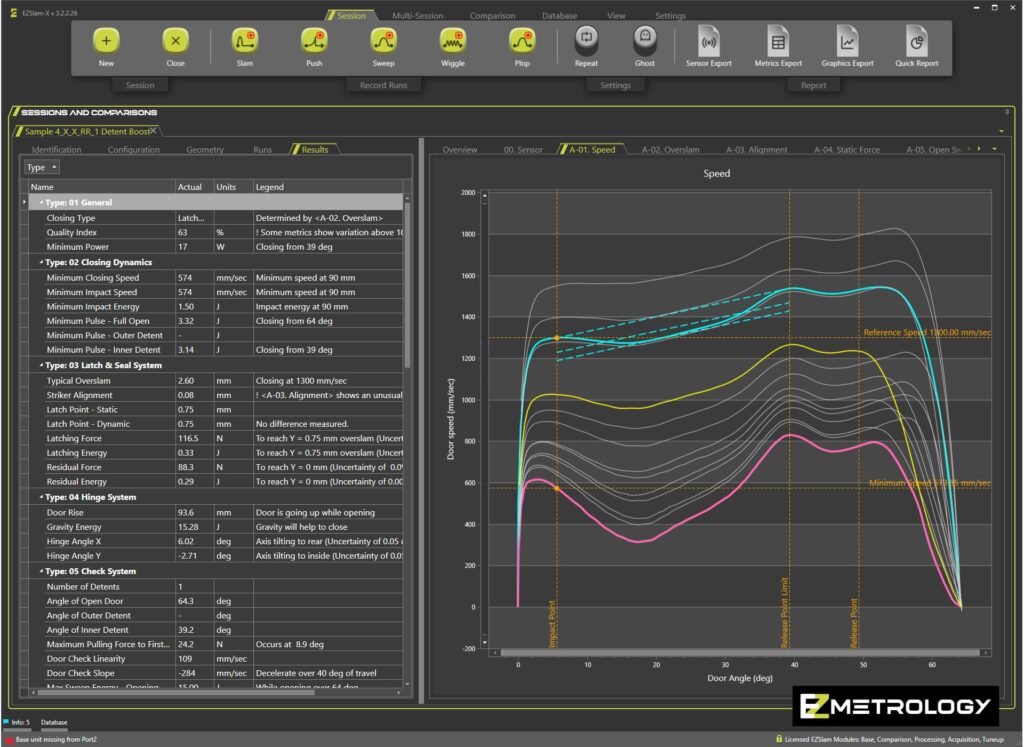
EZSlamX Software Speed Trend Graph with Table
Screenshot of EZSlamX software with trend graphs and table for analysis of door closing speed
![](https://portal.ezmetrology.com/wp-content/uploads/MEIP01003-EZSlam-with-Graphing-on-Car_TH-1024x768.jpg)
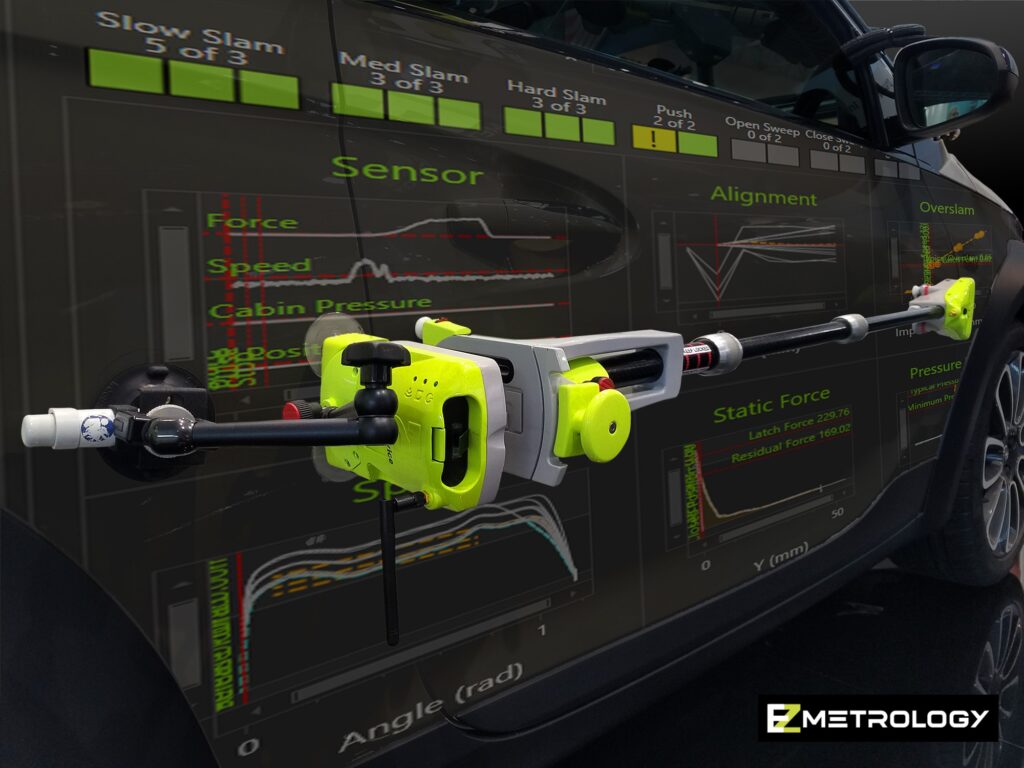
EZSlam with Graphing on Car
EZSlam mounted on a door with graphics superimposed on car door and body panels
![](https://portal.ezmetrology.com/wp-content/uploads/MEIP01004-EZSlamX-Software-Energy-Pie-Charts_TH-1024x747.jpg)
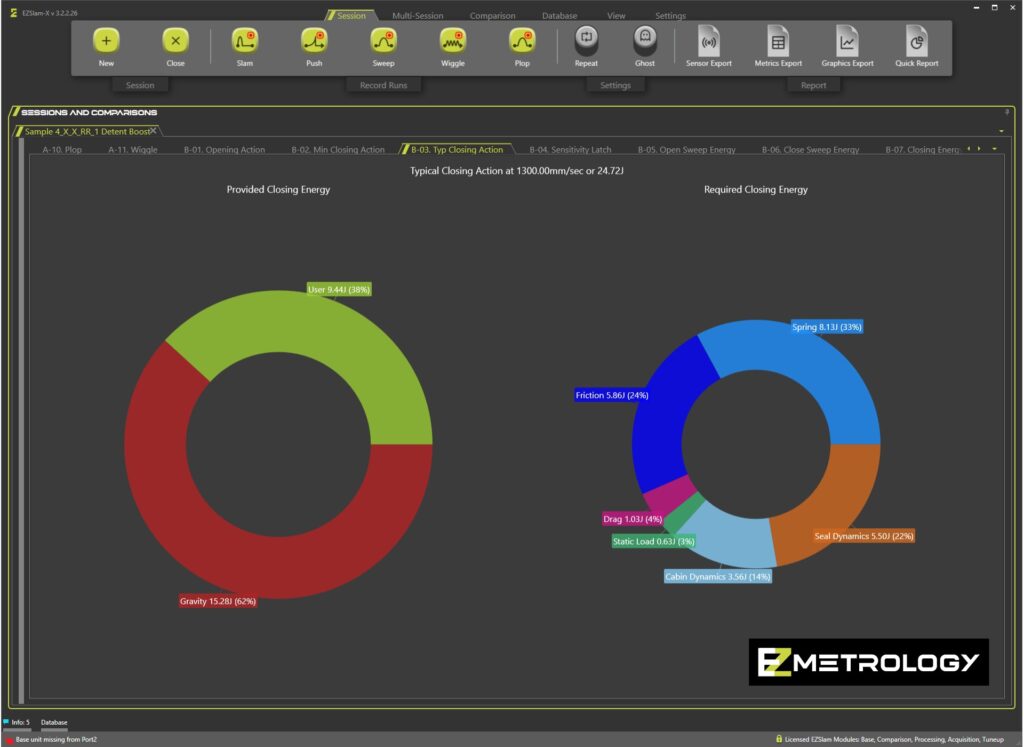
EZSlamX Software Energy Pie Charts
Screenshot of EZSlamX Software demonstrating door closing energy distribution and analysis with pie charts
![](https://portal.ezmetrology.com/wp-content/uploads/TEPS007-EZSlam-Simplified-Troubleshooting_TH-1.jpg)
EZSlam Simplified Troubleshooting
Door System Troubleshooting flowchart using EZSlam
![](https://portal.ezmetrology.com/wp-content/uploads/TEPS005-EZSlam-DoorKit-Audit-Detailed-Comparison_TH-1.jpg)
EZSlam DoorKit Audit Detailed Comparison
Product overview specifications and functionalities for EZSlam and Audit
![](https://portal.ezmetrology.com/wp-content/uploads/TEPS003-EZSlam-Slope-Effect_TH-1.jpg)
EZSlam Slope Effect
Address effects of inclionation during opening and closing actions for EZSlam
![](https://portal.ezmetrology.com/wp-content/uploads/TEPS002-EZSlam-Version-Aspects_TH-1.jpg)
EZSlam Version Aspects
Computation aspects and license compatiblity for various EZSlam versions
![](https://portal.ezmetrology.com/wp-content/uploads/SEPA010-Door-Energy-Balance-Case-Study_TH.jpg)
Door Energy Balance Case Study
Example on how energy models help to characterize a door system
![](https://portal.ezmetrology.com/wp-content/uploads/SEPG001-EZMetrology-Portfolio_TH-1.jpg)
EZMetrology Portfolio
EZMetrology Product Line Up