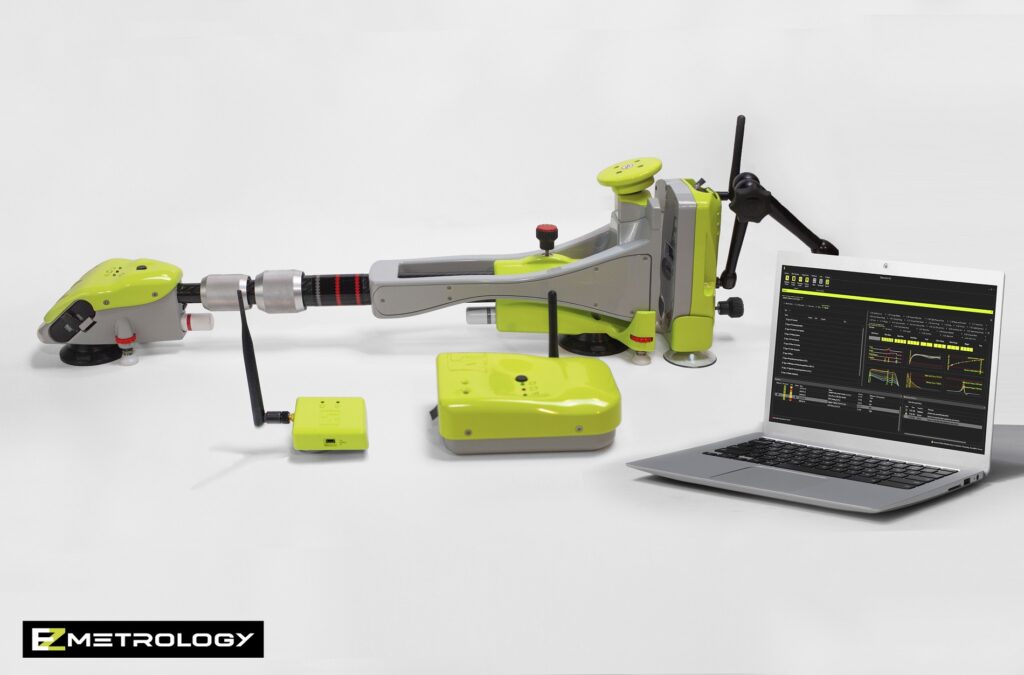
EZSlam Modules with Computer
Photo of EZSlam modules and a laptop computer screen showing EZSlam software with a white background
EZEnergy Logo Green
EZEnergy Product Logo Green
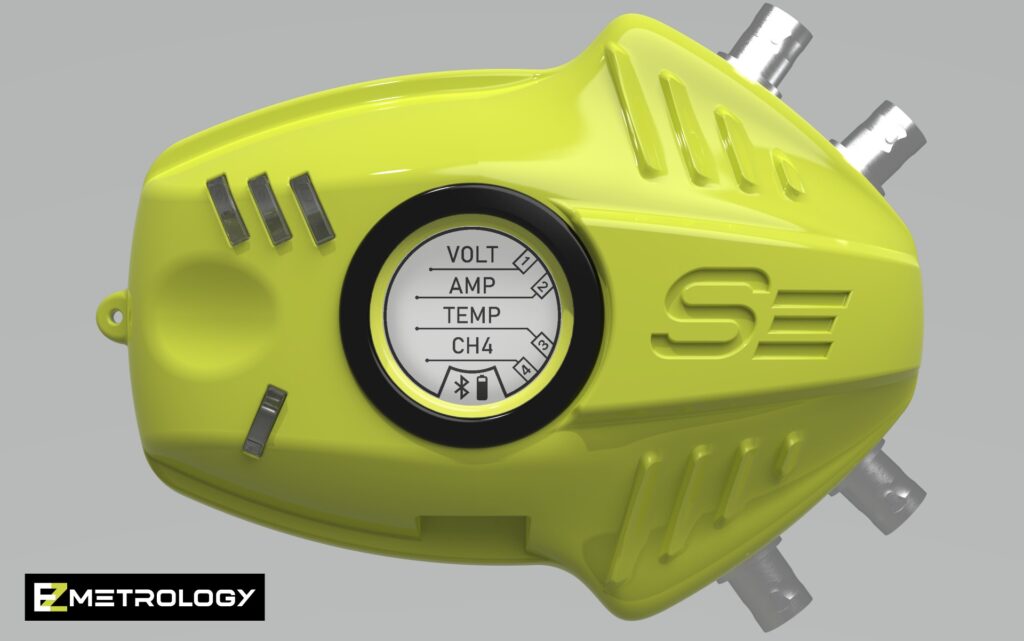
SensorPod Rendering Channels Screen Front View
SensorPod with Channels
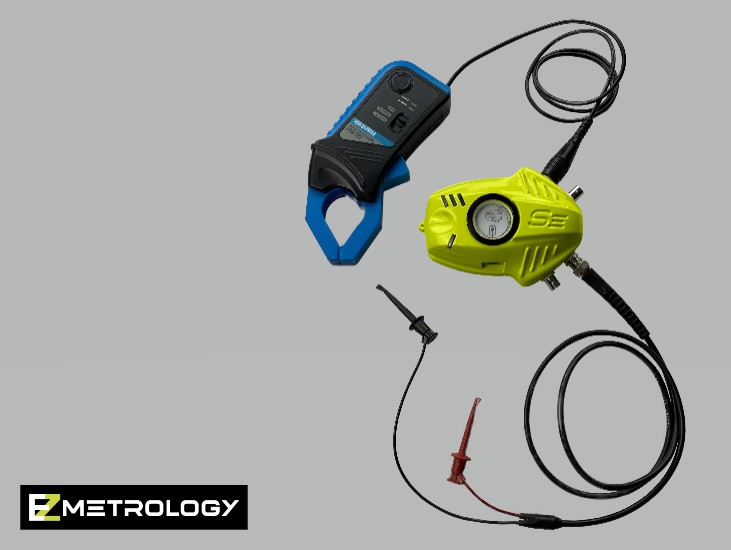
SensorPod with Electrical Connections
SensorPod with electrical connections to clamp meter
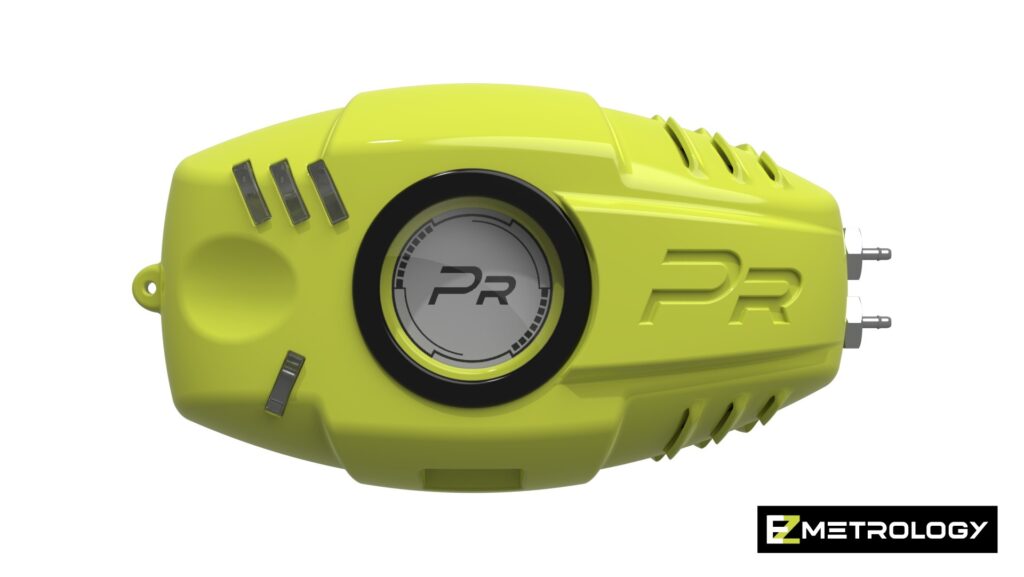
PressurePod Rendering on White Background
PressurePod device
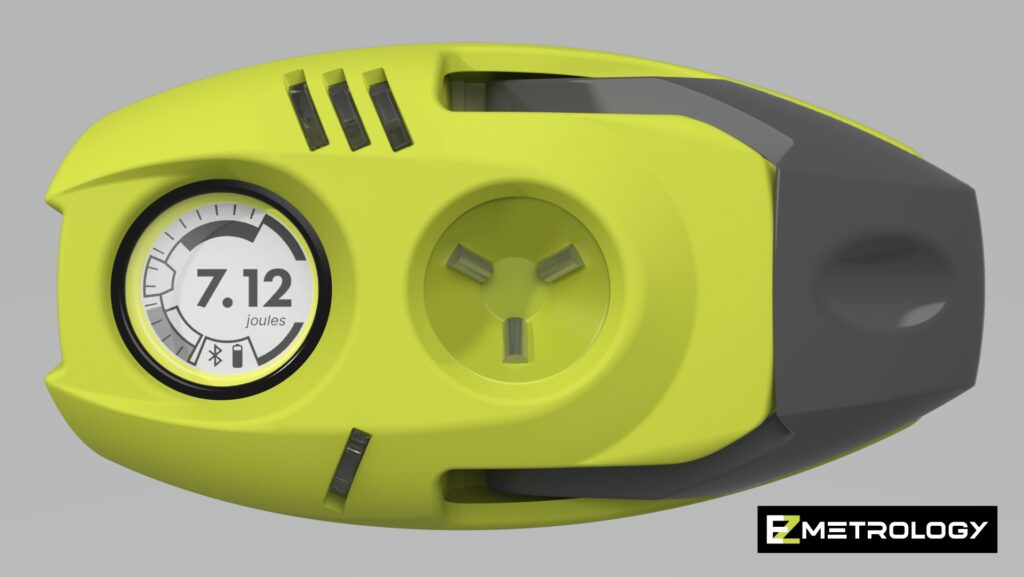
EnergyPod Rendering Measurement Screen Front View
EnergyPod with measurement screen
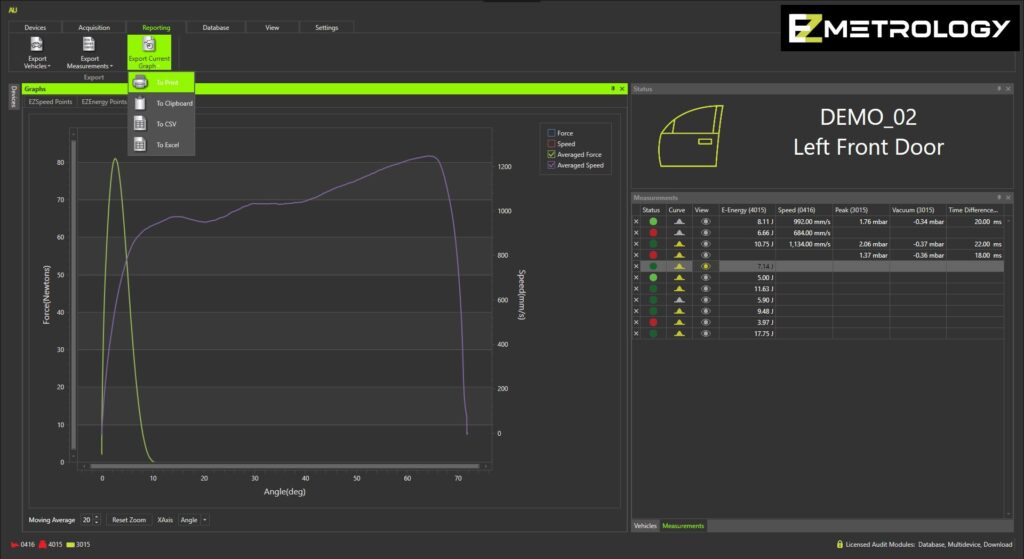
Audit Screen Force and Speed Graph
Screenshot of graph with force and speed trends for Audit software
SensorPod Rendering on White Background
SensorPod device
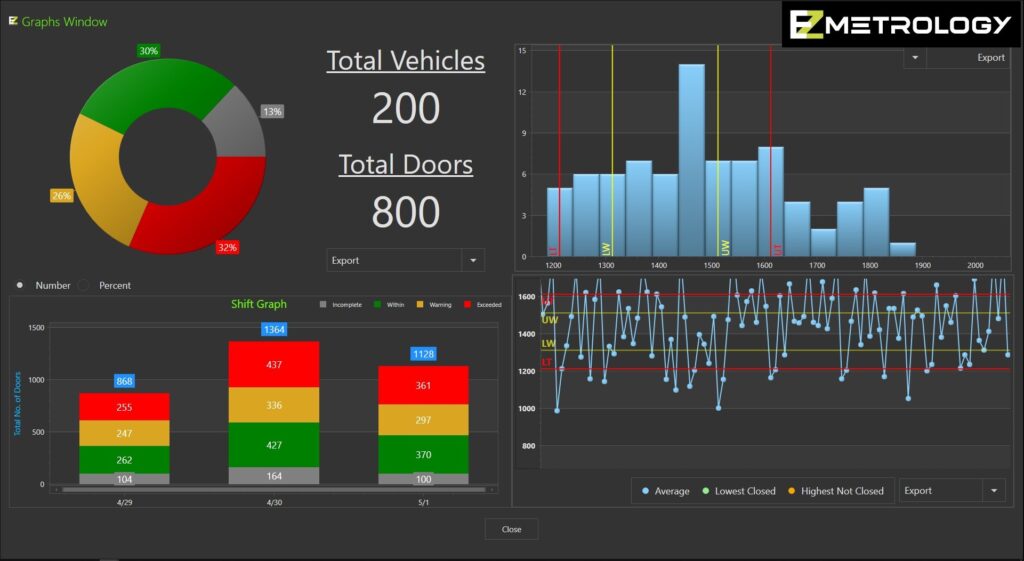
PLS Graphs Screen
Screenshot of graphs screen for PLS software
PLS Flat Screen Offset with EZM Logo
Image of PLS used with EZSpeed on truck production line
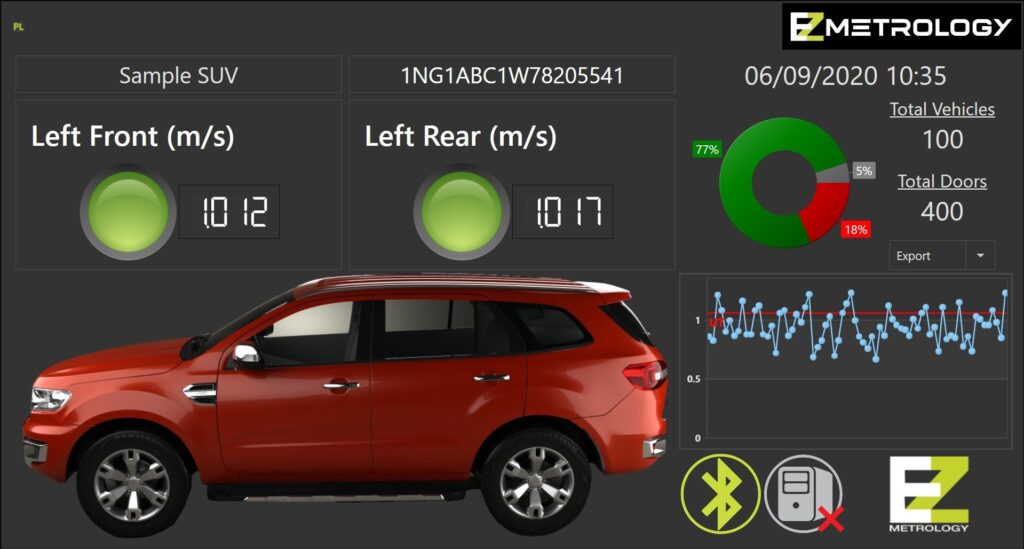
PLS Screen SUV with Trend and Pie Charts
Screenshot of PLS software screen when used to monitor SUV production line
EZSlamX Software Screenshot of Cabin Pressure Transient
Screenshot of EZSlamX software illustrating sample measurement of door cabin pressure as car door is closed and cabin release valve opens
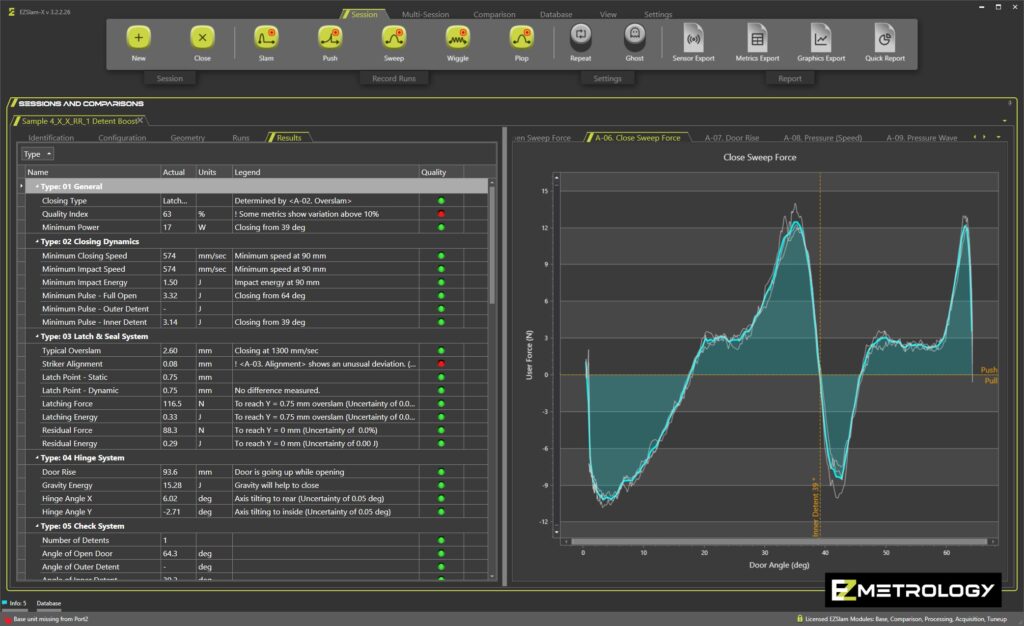
EZSlamX Software Close Sweep Force
Screenshot of EZSlamX software showing graphs for door closing sweep force
EZEnergy Mounted on Door
Image of EZEnergy mounted on a car door
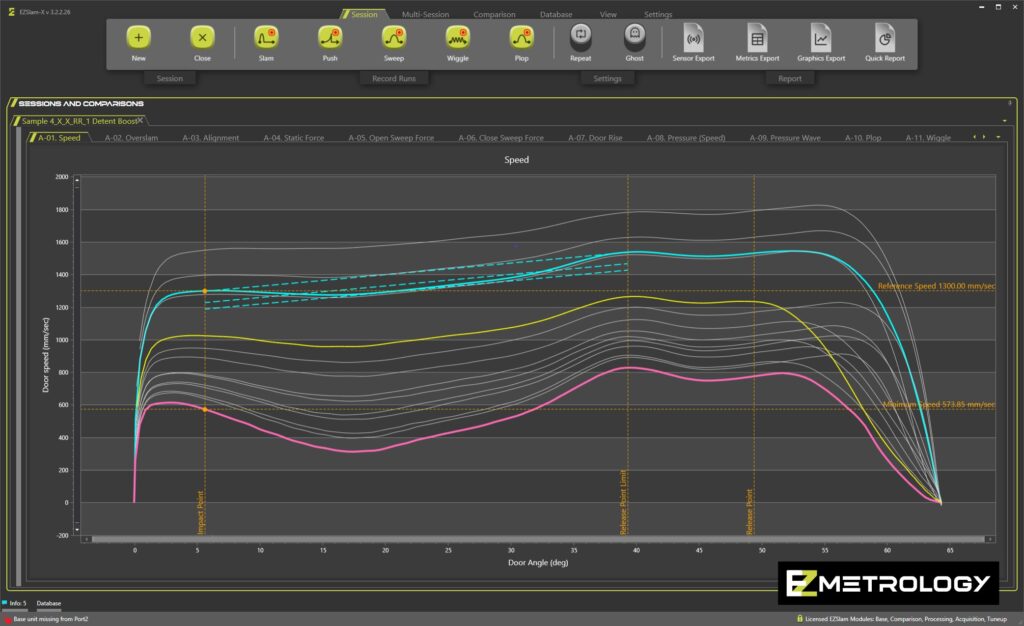
EZSlamX Software Speed Trend Charts Only
Screenshot of EZSlamX software showing trend charts for door closing speed analysis