Browse Library
13 posts found
Expertise
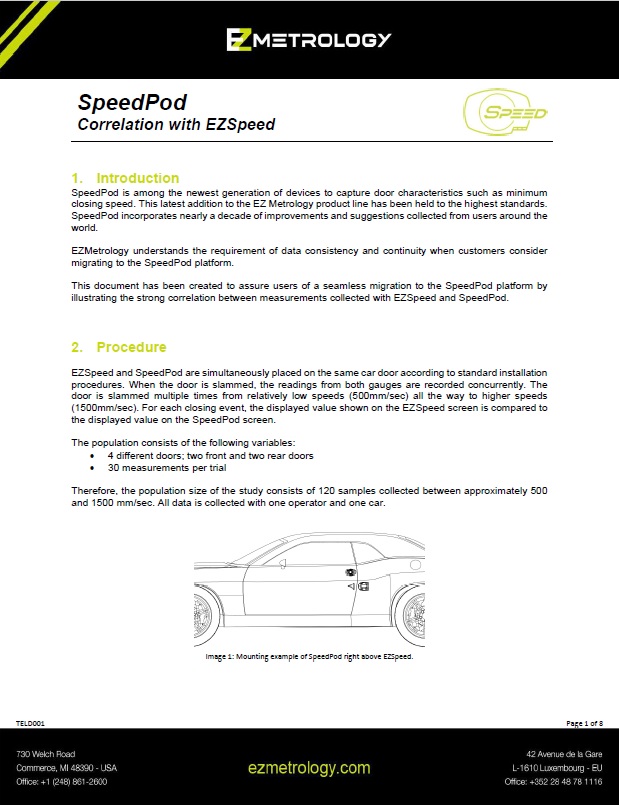
EZSpeed vs SpeedPod Correlation
Test data demonstrating correlation between EZSpeed and SpeedPod performance
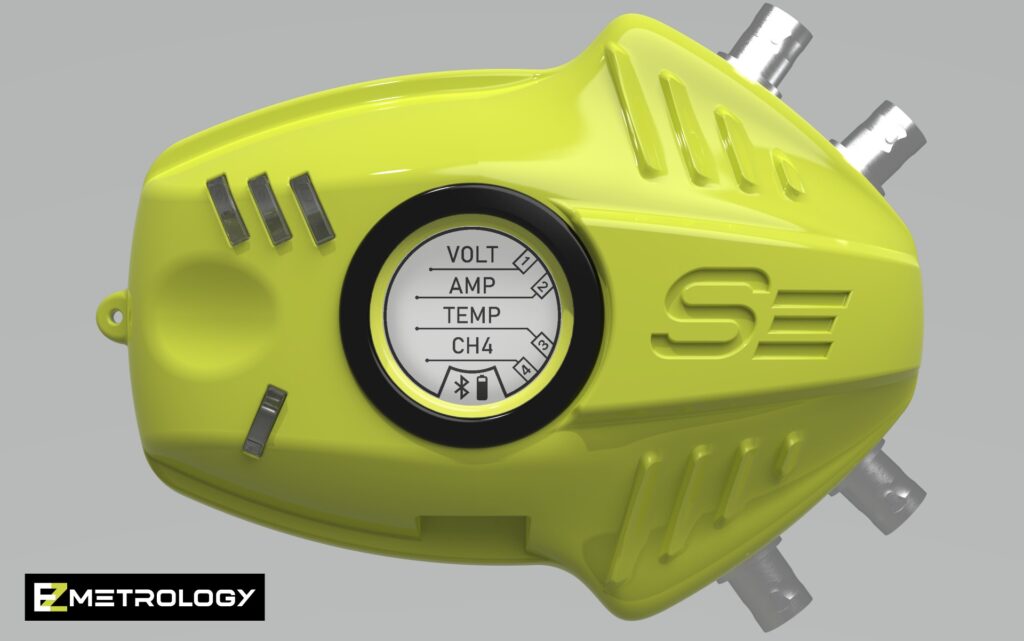
SensorPod Rendering Channels Screen Front View
SensorPod with Channels
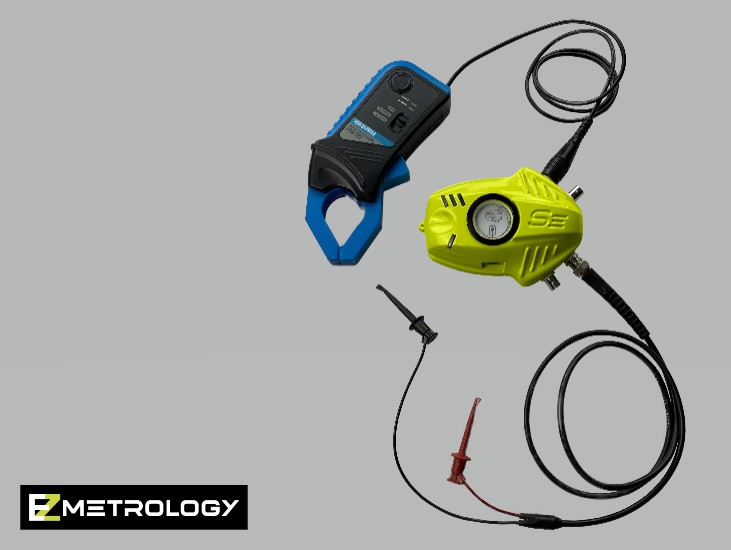
SensorPod with Electrical Connections
SensorPod with electrical connections to clamp meter
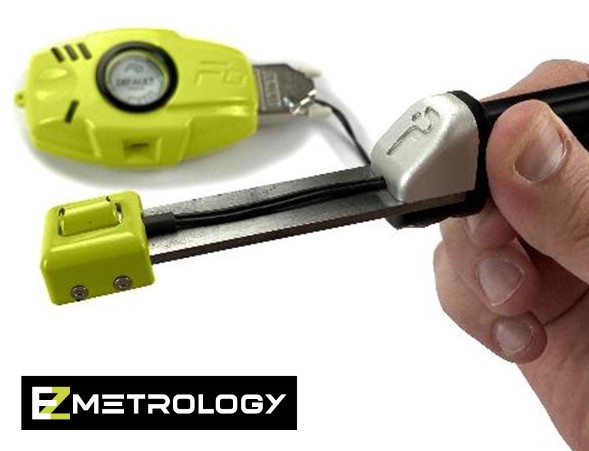
Pinch Connected to ForcePod
Pinch Sensor connected to ForcePod
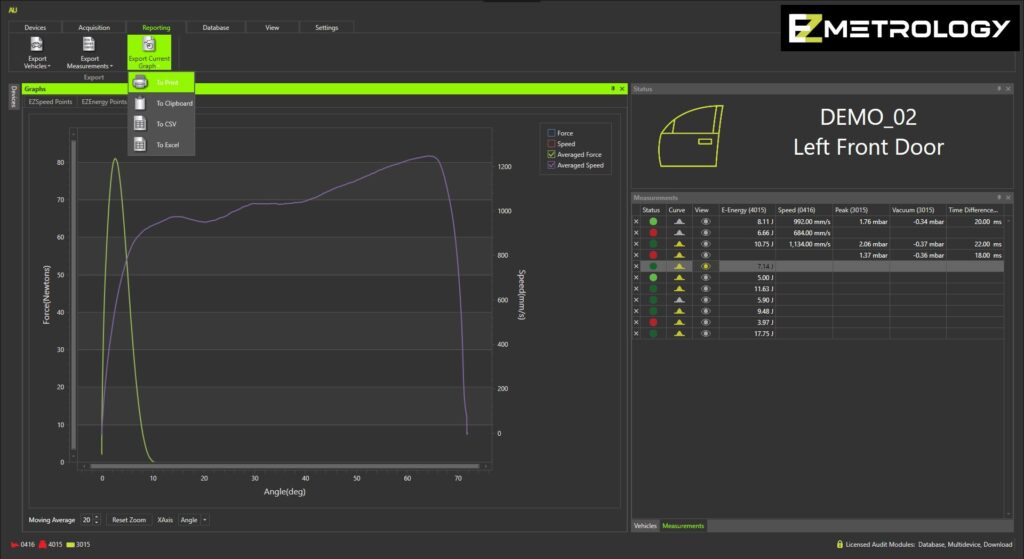
Audit Screen Force and Speed Graph
Screenshot of graph with force and speed trends for Audit software
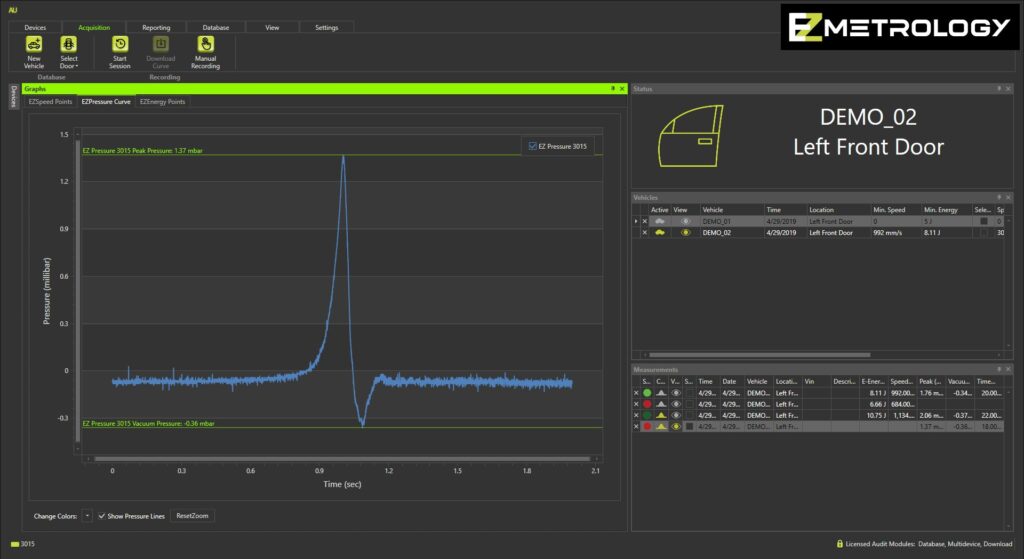
Audit Screen Pressure Transient Curve
Screenshot of pressure transient curve for Audit software
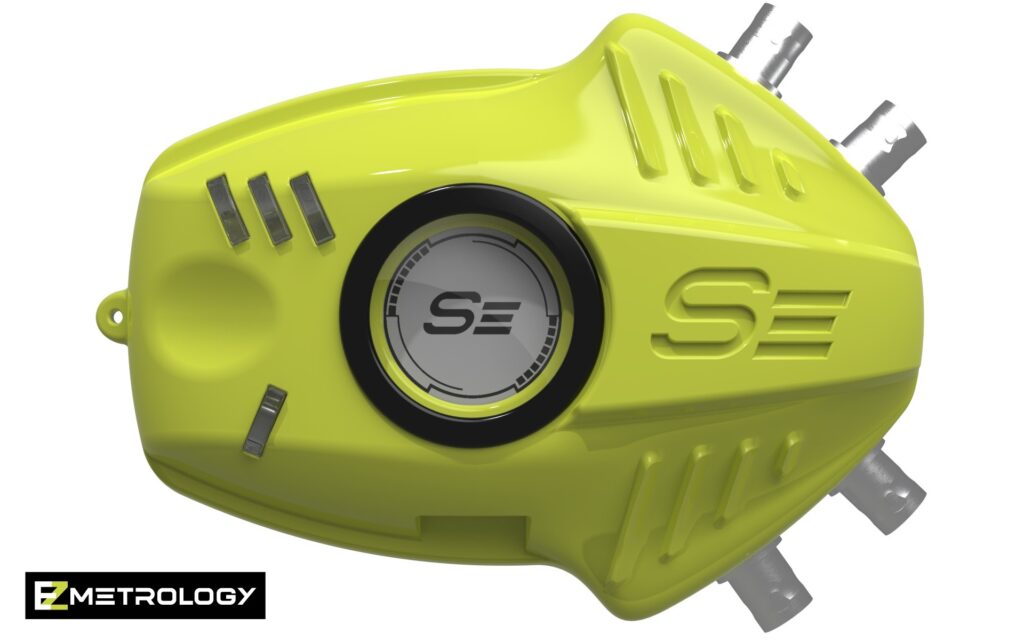
SensorPod Rendering on White Background
SensorPod device
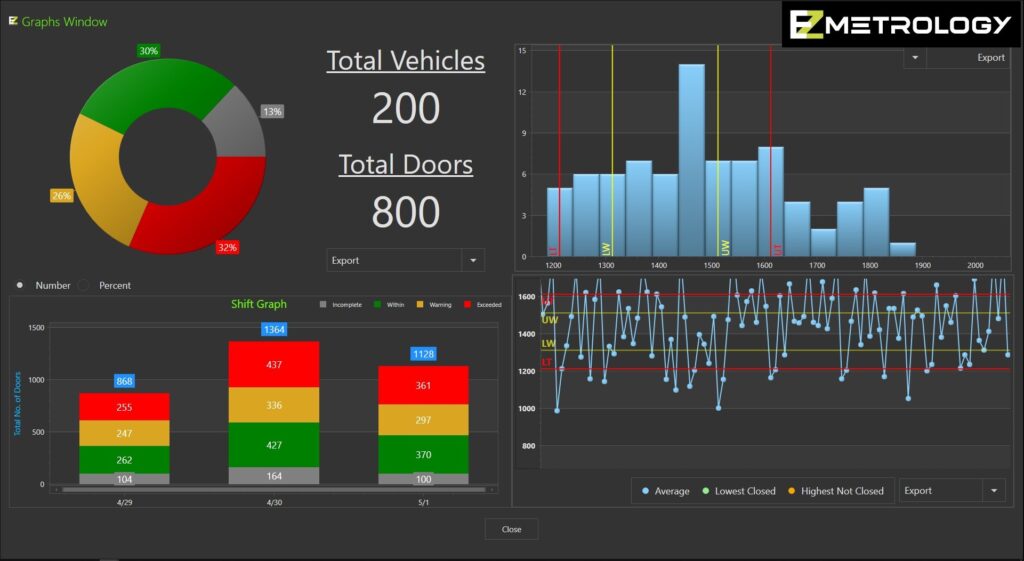
PLS Graphs Screen
Screenshot of graphs screen for PLS software
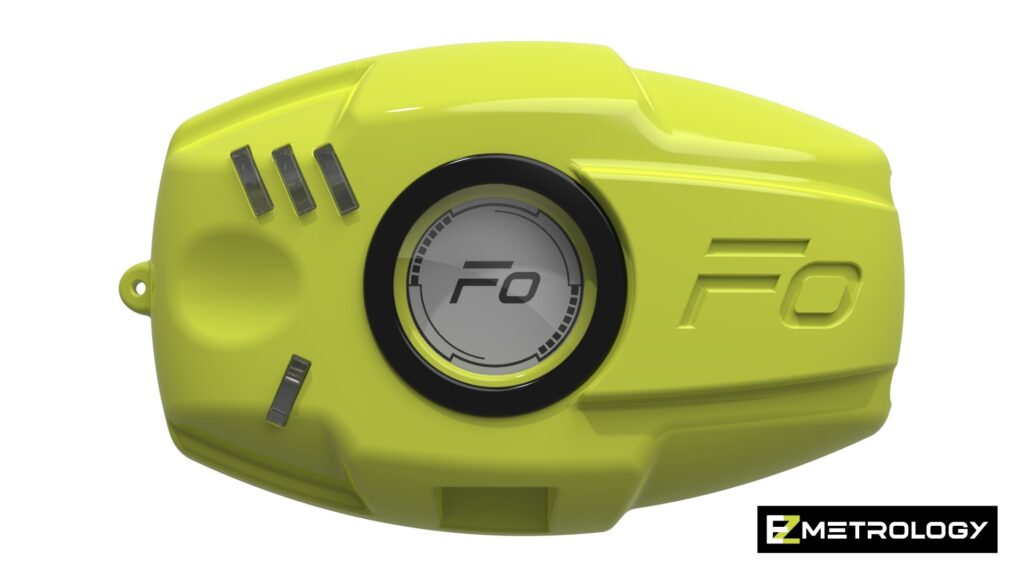
ForcePod Rendering on White Background
ForcedPod device
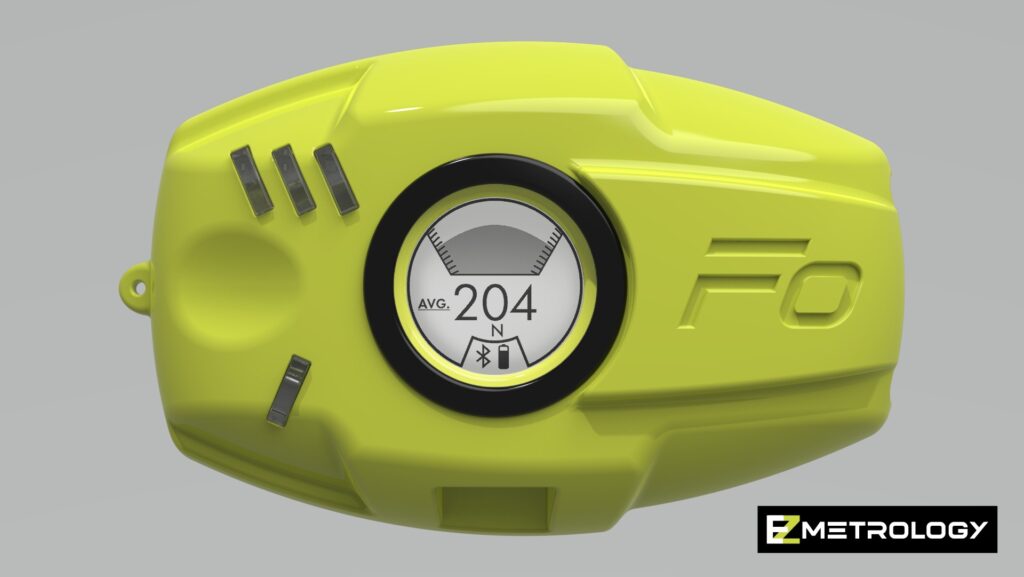
ForcePod Rendering Measurement Screen Front View
ForcePod displaying the measurement screen
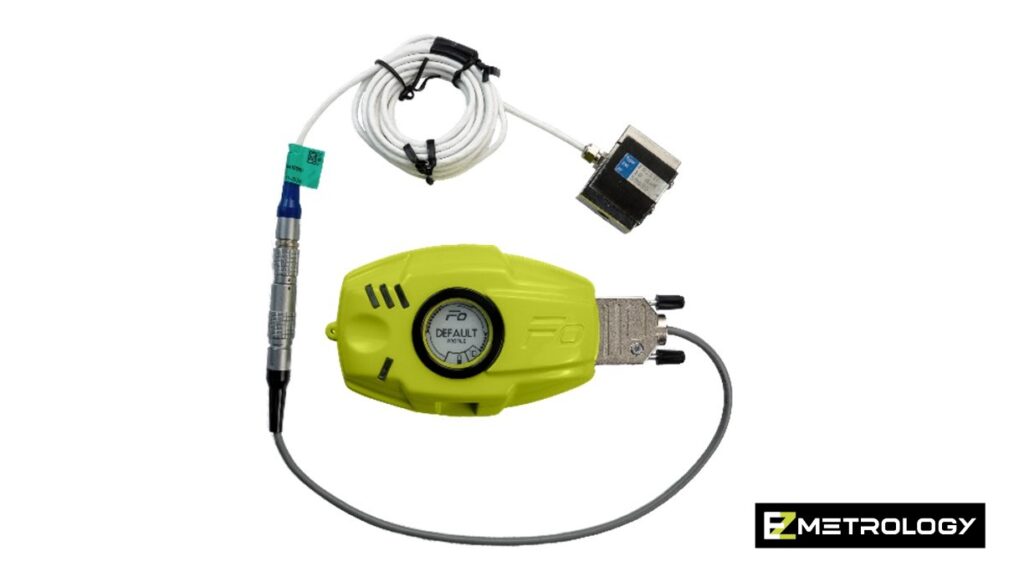
ForcePod with Load Cell Connected
ForcePod connected to a Load Cell
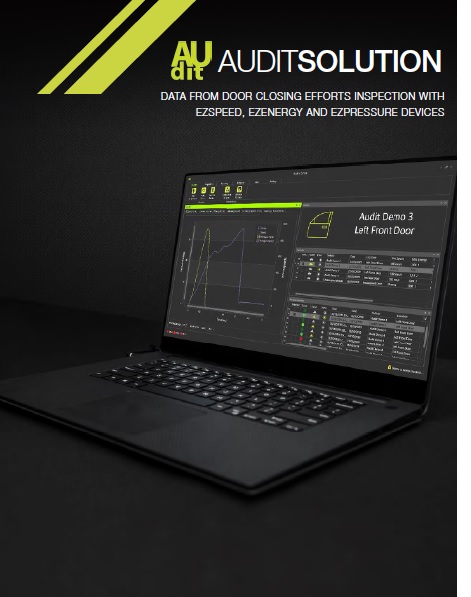
Audit Brochure
Brief overview of Audit software for data collection and in depth analysis
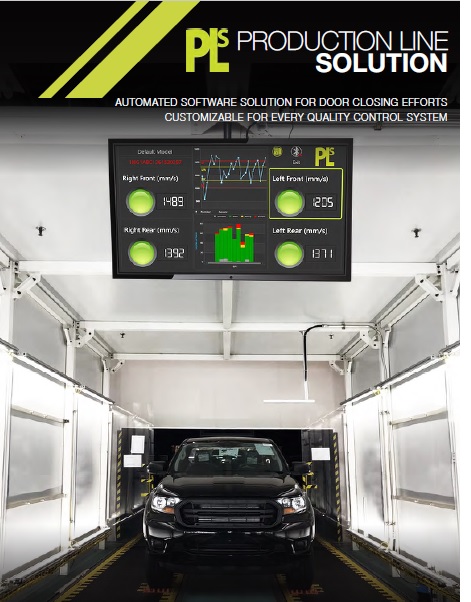
PLS Brochure
Brief overview of PLS software used for data collection and reporting to quality management systems
