Browse Library
66 posts found
![](https://portal.ezmetrology.com/wp-content/uploads/MEIP12002-ForcePod-Rendering-Measurement-Screen-Front-View_TH-1024x577.jpg)
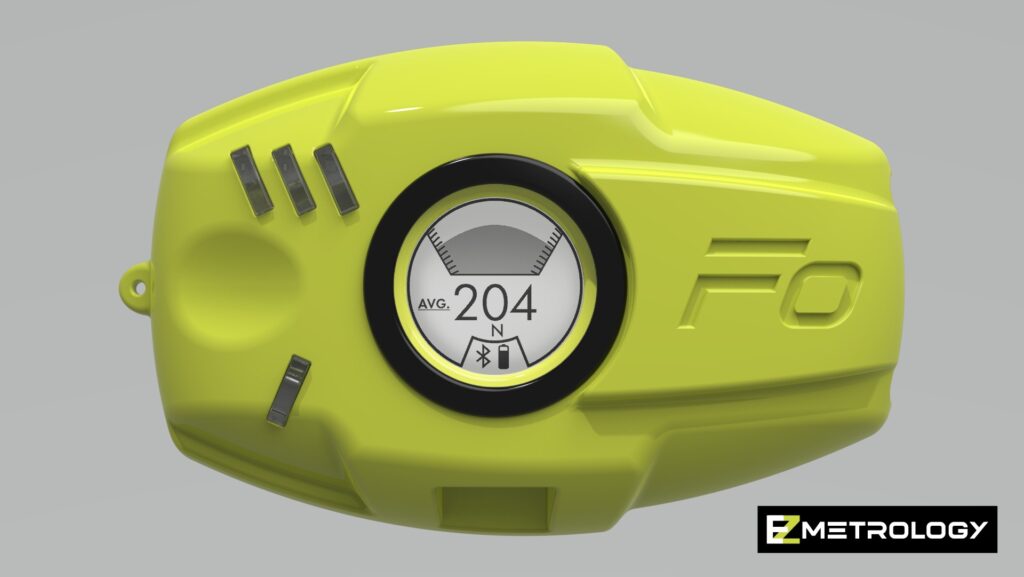
ForcePod Rendering Measurement Screen Front View
ForcePod displaying the measurement screen
![](https://portal.ezmetrology.com/wp-content/uploads/MEIP12003-ForcePod-with-Load-Cell-Connected_TH-1024x587.jpg)
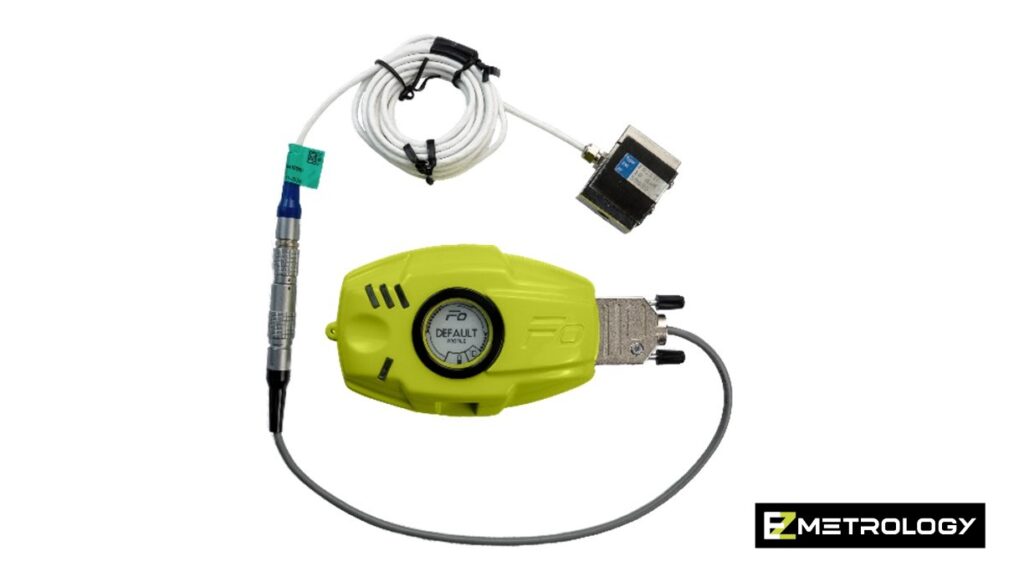
ForcePod with Load Cell Connected
ForcePod connected to a Load Cell
![](https://portal.ezmetrology.com/wp-content/uploads/MEIP13001-SpeedPod-Hands-Grabbing-Device-on-Truck_TH-1024x498.jpg)
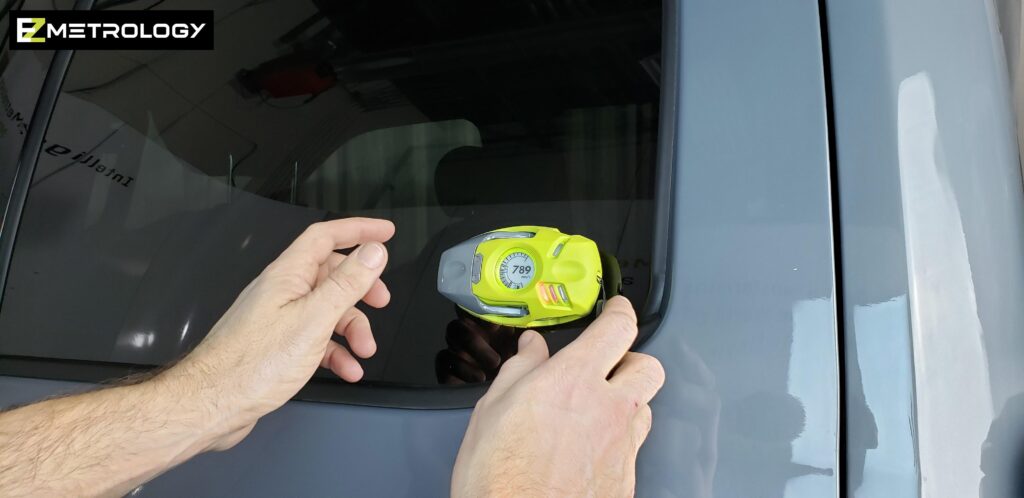
SpeedPod Hands Grabbing Device on Truck
Image of person s hands reaching for SpeedPod mounted on truck window
![](https://portal.ezmetrology.com/wp-content/uploads/MEIP11001-IOManager-Channels-Table_TH-1024x547.jpg)
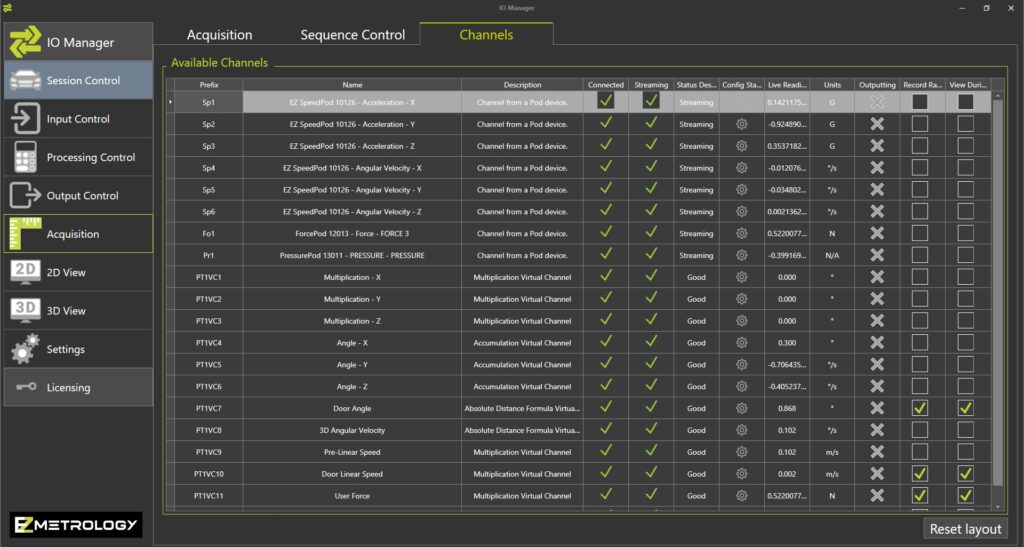
IOManager Channels Table
IOManager software screenshot illustrating table of channels
![](https://portal.ezmetrology.com/wp-content/uploads/MEIP11002-IOManager-Live-Screen_TH-1024x547.jpg)
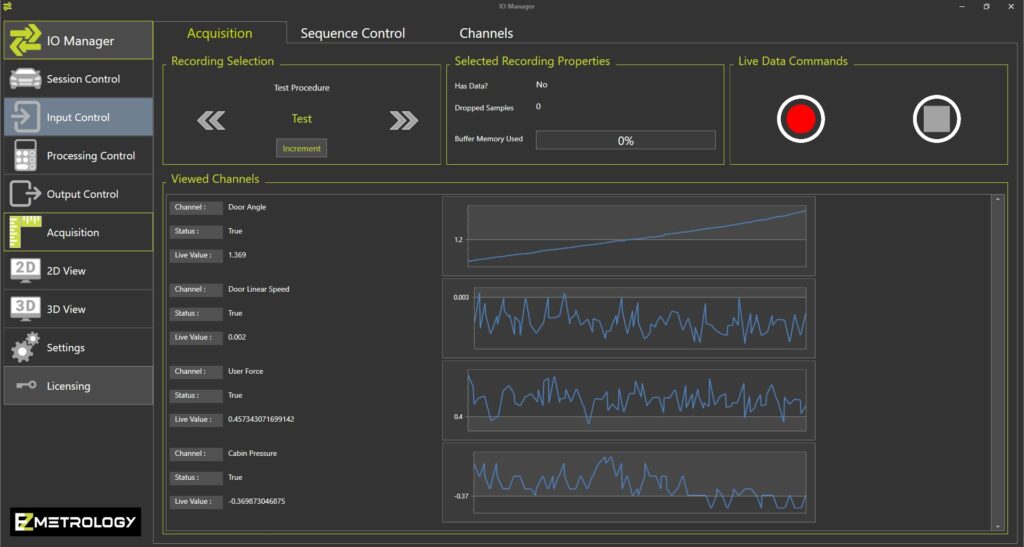
IOManager Live Screen
IOManager screenshot of live mode monitoring
![](https://portal.ezmetrology.com/wp-content/uploads/MEIP01007-EZSlamX-Software-Screenshot-of-Cabin-Pressure-Transient_TH-1024x576.jpg)
EZSlamX Software Screenshot of Cabin Pressure Transient
Screenshot of EZSlamX software illustrating sample measurement of door cabin pressure as car door is closed and cabin release valve opens
![](https://portal.ezmetrology.com/wp-content/uploads/MEIP01008-EZSlamX-Software-Close-Sweep-Force_TH-1024x626.jpg)
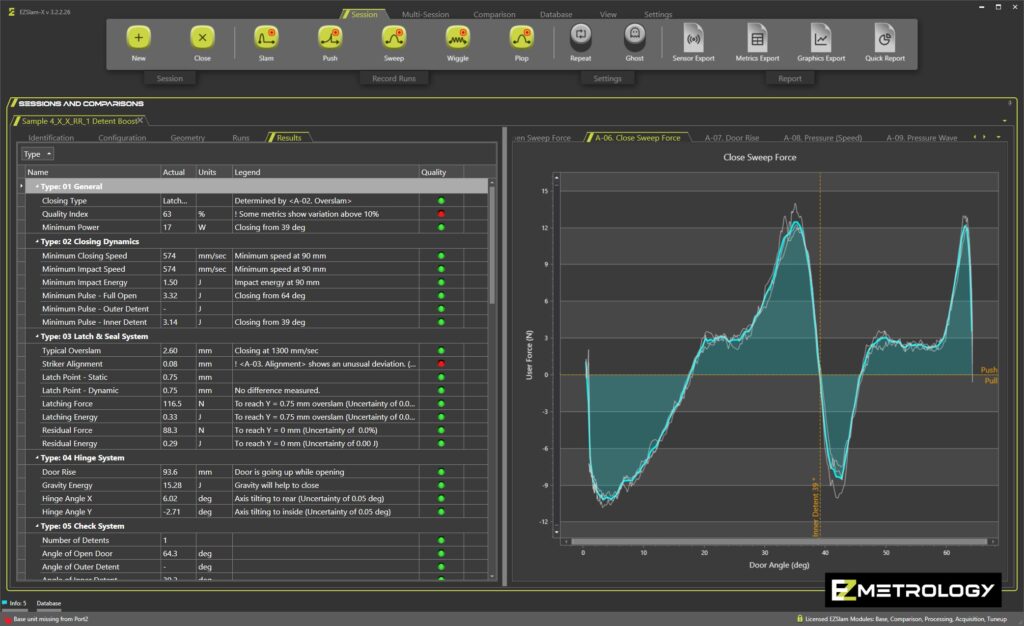
EZSlamX Software Close Sweep Force
Screenshot of EZSlamX software showing graphs for door closing sweep force
![](https://portal.ezmetrology.com/wp-content/uploads/MEIP01005-EZSlamX-Software-Speed-Trend-Charts-Only_TH-1024x626.jpg)
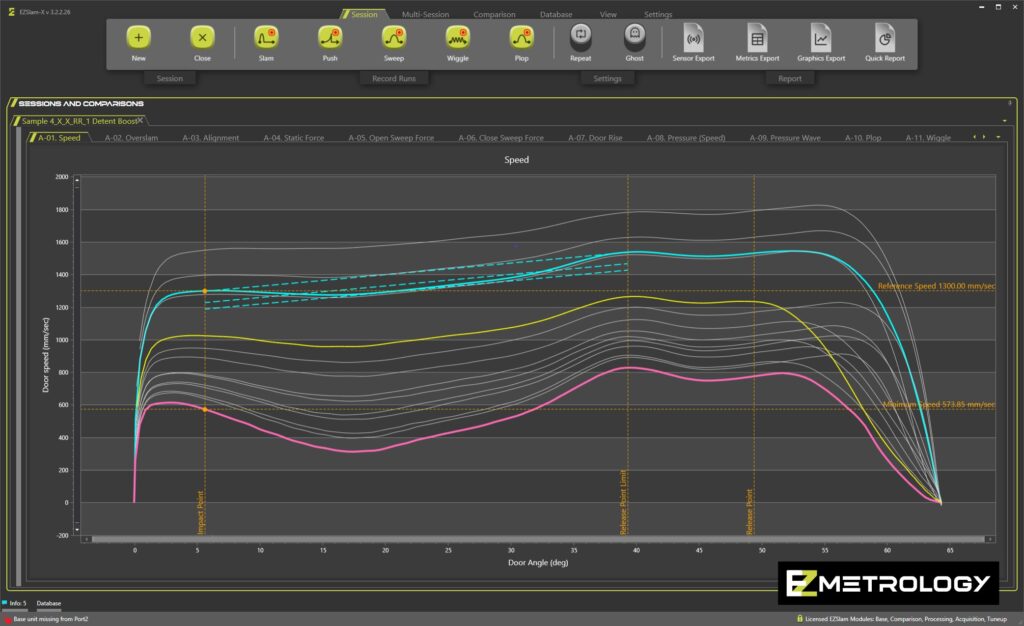
EZSlamX Software Speed Trend Charts Only
Screenshot of EZSlamX software showing trend charts for door closing speed analysis
![](https://portal.ezmetrology.com/wp-content/uploads/MEIP01006-EZSlamX-Software-Speed-Trend-Graph-with-Table_TH-1024x747.jpg)
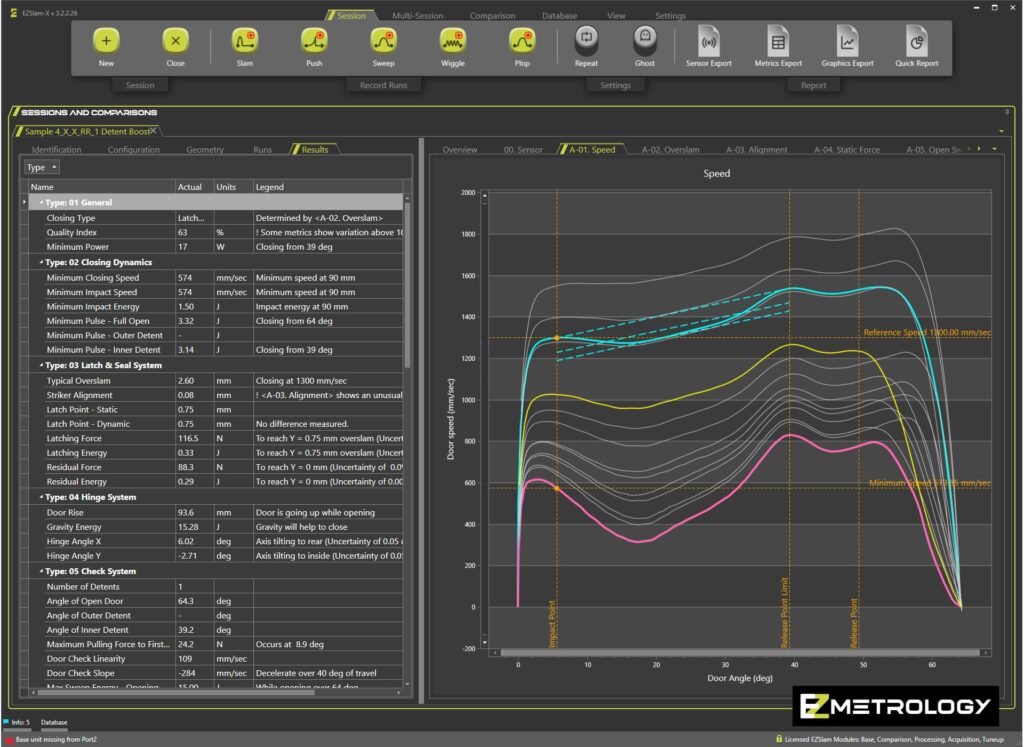
EZSlamX Software Speed Trend Graph with Table
Screenshot of EZSlamX software with trend graphs and table for analysis of door closing speed
![](https://portal.ezmetrology.com/wp-content/uploads/MEIP01001-EZSlam-Mounted-on-Front-Door_TH-1024x683.jpg)
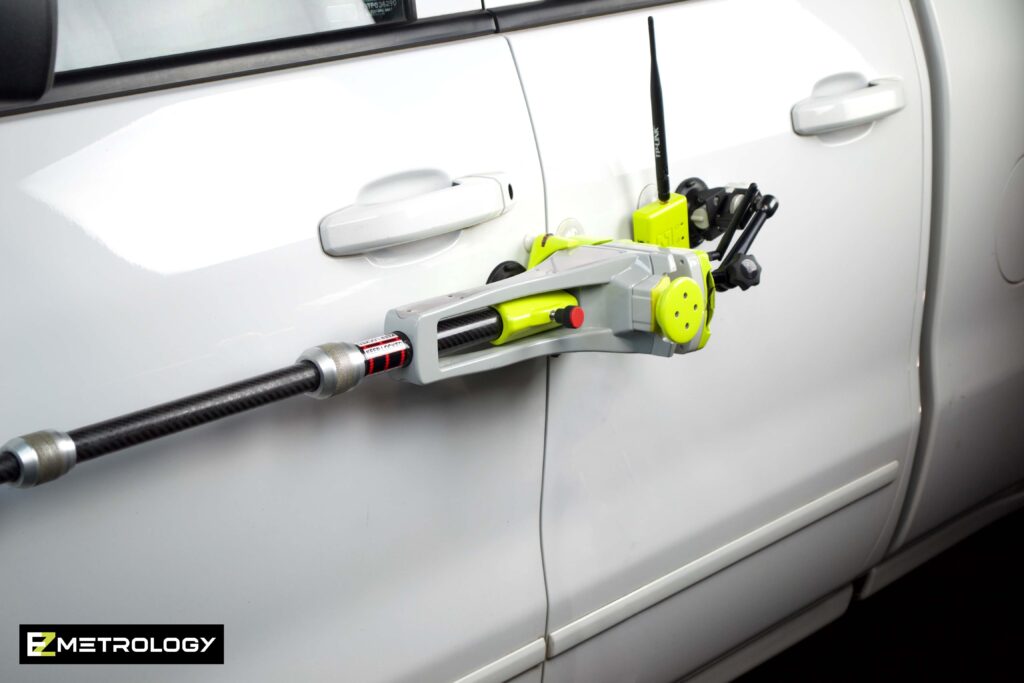
EZSlam Mounted on Front Door
Image of EZSlam mounted on white front door
![](https://portal.ezmetrology.com/wp-content/uploads/MEIP01003-EZSlam-with-Graphing-on-Car_TH-1024x768.jpg)
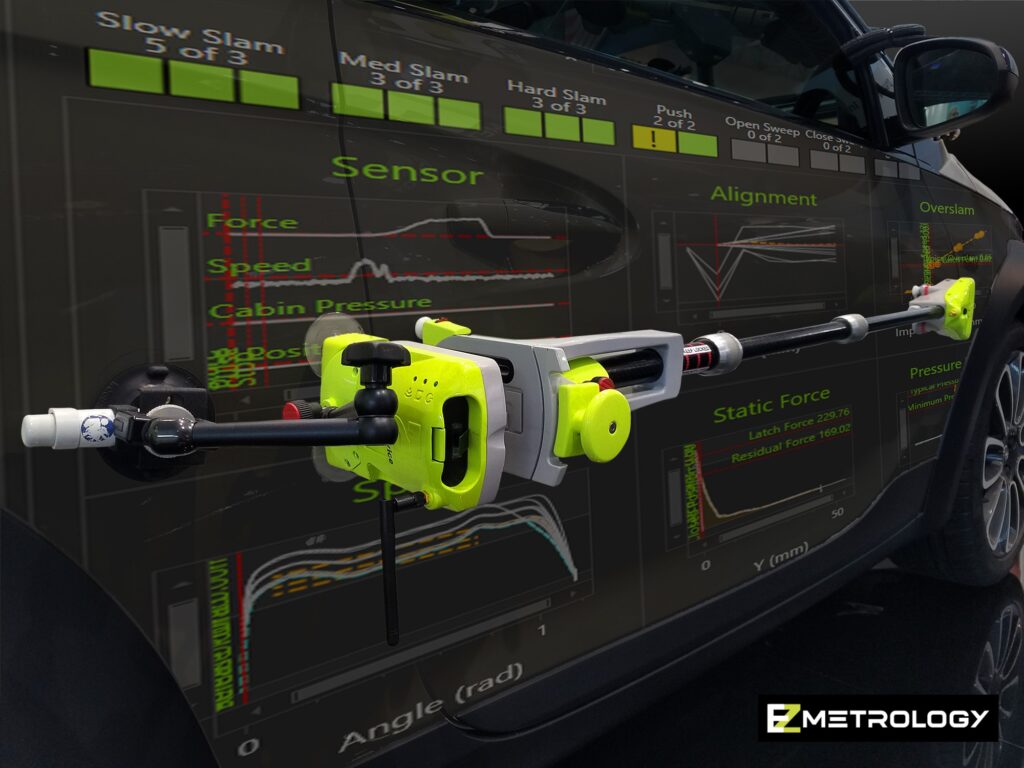
EZSlam with Graphing on Car
EZSlam mounted on a door with graphics superimposed on car door and body panels
![](https://portal.ezmetrology.com/wp-content/uploads/MEIP01004-EZSlamX-Software-Energy-Pie-Charts_TH-1024x747.jpg)
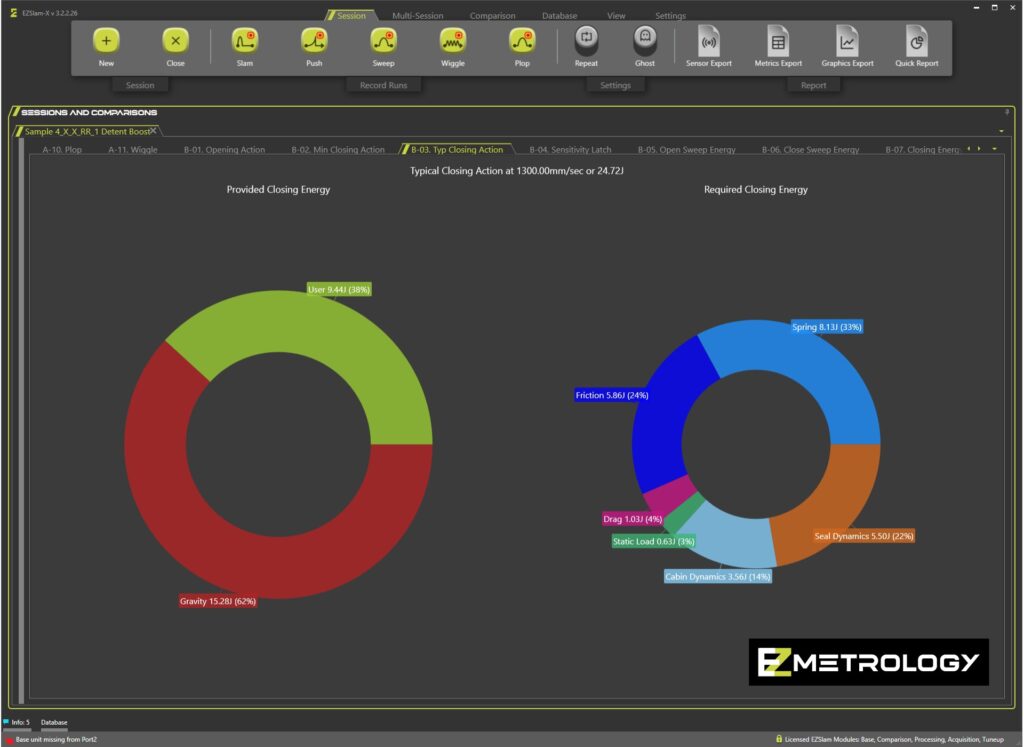
EZSlamX Software Energy Pie Charts
Screenshot of EZSlamX Software demonstrating door closing energy distribution and analysis with pie charts
![](https://portal.ezmetrology.com/wp-content/uploads/TEPS009-Correlation-EZMotion-Step_TH-1.jpg)
Correlation EZMotion Step
Performance of the dynamic aspects of EZMotion using a magnetic drive and linear position sensor
![](https://portal.ezmetrology.com/wp-content/uploads/TEPS008-IOManager-Latency_TH.jpg)
IOManager Latency
Latency characteristics when using IOManager
![](https://portal.ezmetrology.com/wp-content/uploads/TEPS007-EZSlam-Simplified-Troubleshooting_TH-1.jpg)
EZSlam Simplified Troubleshooting
Door System Troubleshooting flowchart using EZSlam