Browse Library
22 posts found
![](https://portal.ezmetrology.com/wp-content/uploads/TELD002-SpeedPod-Performance-Data_TH.jpg)
SpeedPod Performance Data
SpeedPod performance data demonstrating reproduc
![](https://portal.ezmetrology.com/wp-content/uploads/TELD001-EZSpeed-vs-SpeedPod-Correlation_TH.jpg)
EZSpeed vs SpeedPod Correlation
Test data demonstrating correlation between EZSpeed and SpeedPod performance
![](https://portal.ezmetrology.com/wp-content/uploads/TELD004-SpeedPod-Datasheet-Overview_TH.jpg)
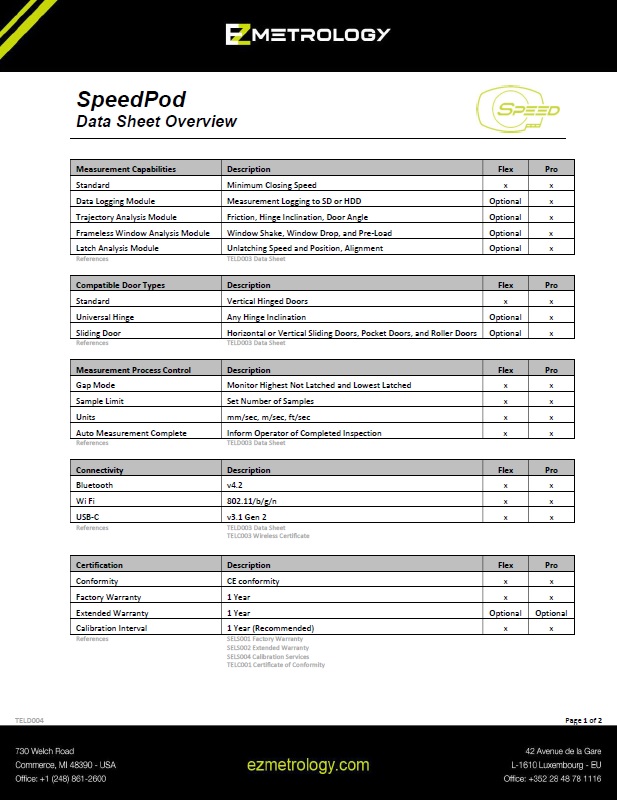
SpeedPod Datasheet Overview
SpeedPod datasheet with key features summarized in table format
![](https://portal.ezmetrology.com/wp-content/uploads/MEIP20001-Audit-Screen-Force-and-Speed-Graph_TH-1024x559.jpg)
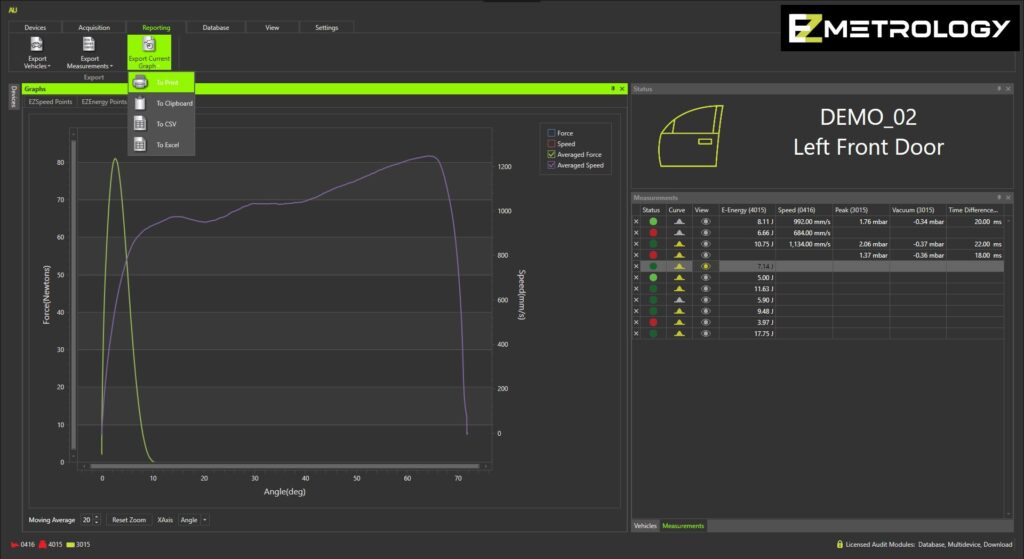
Audit Screen Force and Speed Graph
Screenshot of graph with force and speed trends for Audit software
![](https://portal.ezmetrology.com/wp-content/uploads/MEIP20002-Audit-Screen-Pressure-Transient-Curve_TH-1024x559.jpg)
Audit Screen Pressure Transient Curve
Screenshot of pressure transient curve for Audit software
![](https://portal.ezmetrology.com/wp-content/uploads/MEIP13006-SpeedPod-and-USB-Connection_TH-1024x683.jpg)
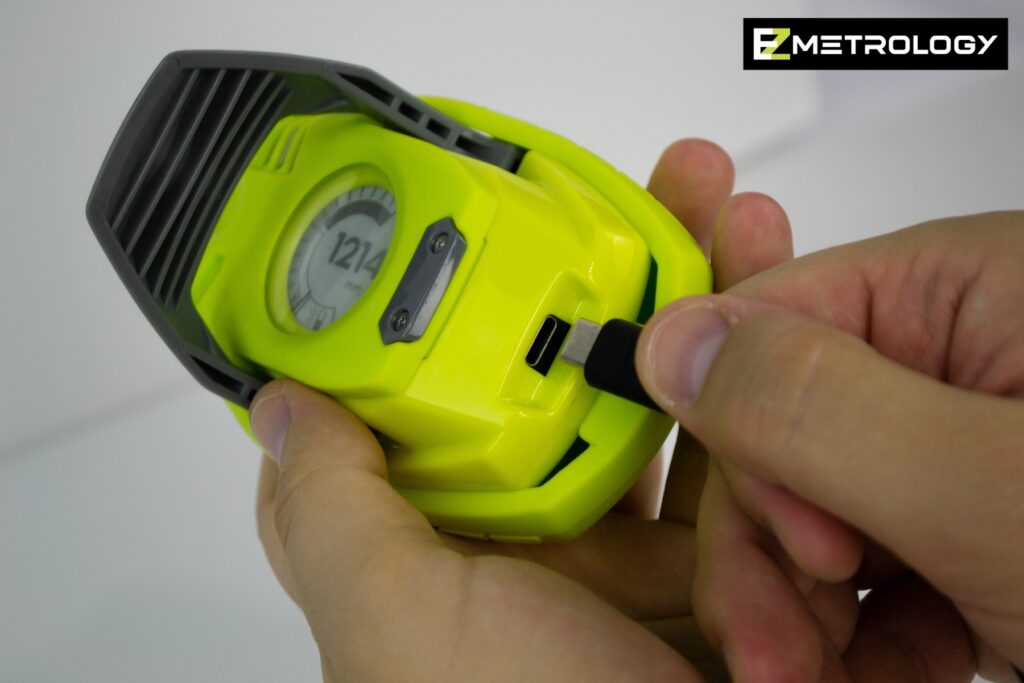
SpeedPod and USB Connection
Image of USB connection for SpeedPod
![](https://portal.ezmetrology.com/wp-content/uploads/MEIP13003-SpeedPod-above-Door-Handle-on-White-Door_TH-1024x576.jpg)
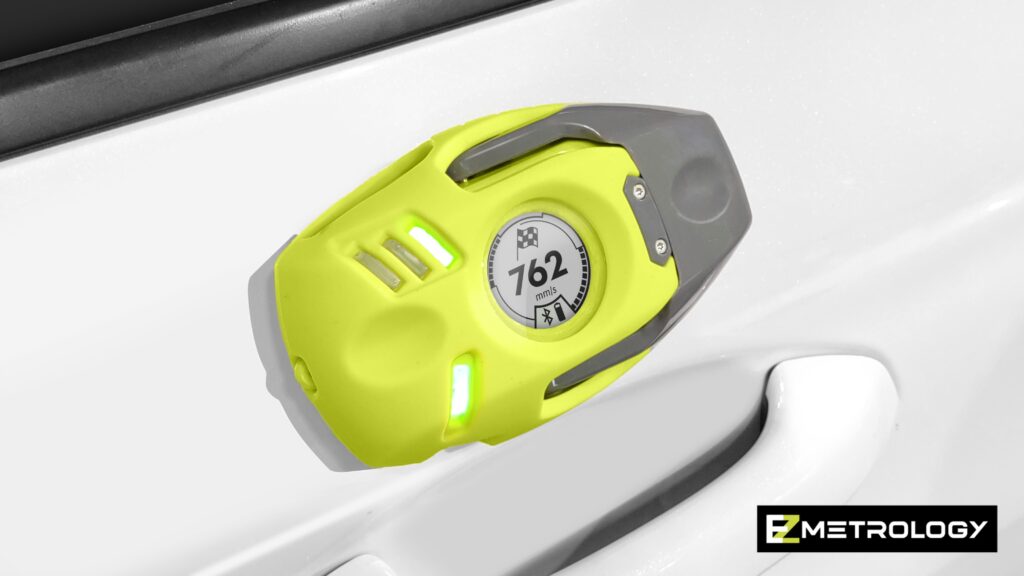
SpeedPod above Door Handle on White Door
SpeedPod mounted on a white hinged door above the door handle
![](https://portal.ezmetrology.com/wp-content/uploads/MEIP13004-SpeedPod-on-Power-Station_TH-1024x766.jpg)
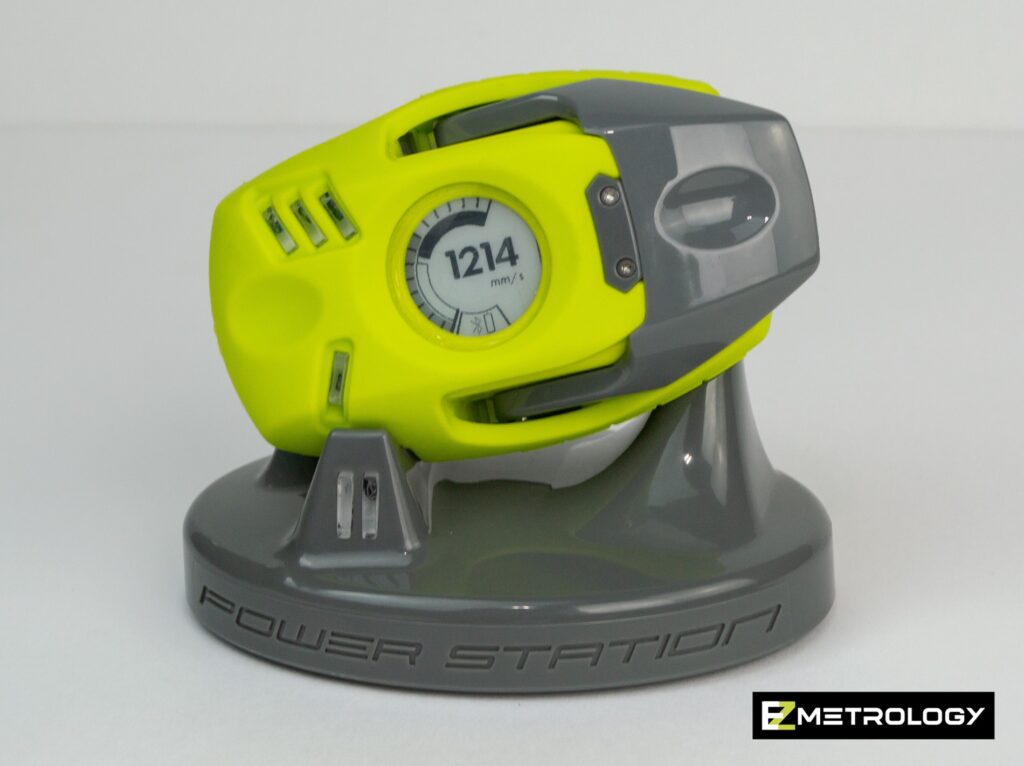
SpeedPod on Power Station
Image of SpeedPod mounted and charging on Power Station
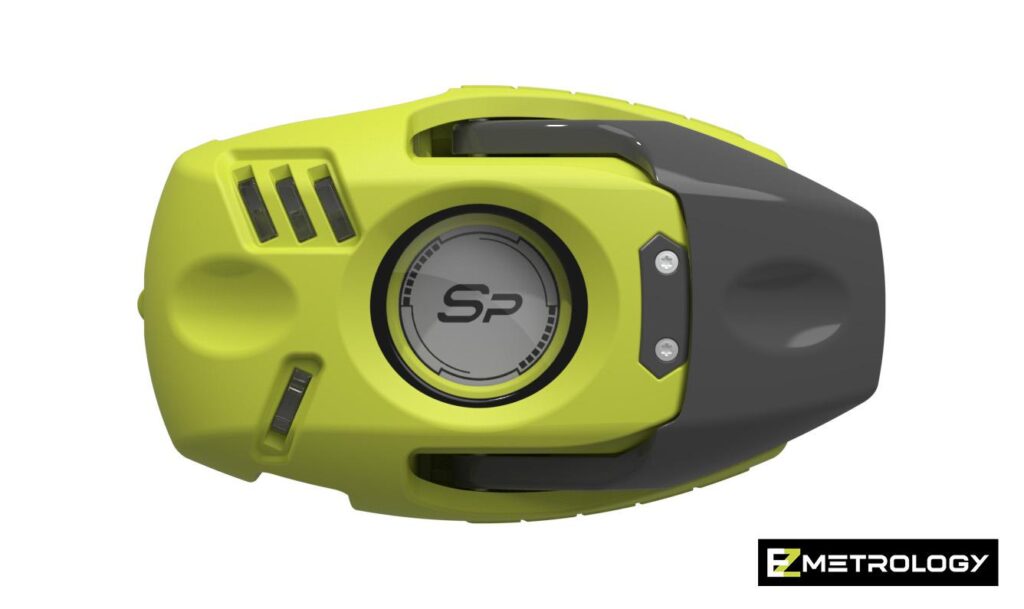
![](https://portal.ezmetrology.com/wp-content/uploads/MEIP13002-SpeedPod-Rendering_TH-1024x609.jpg)
SpeedPod Rendering
SpeedPod device
![](https://portal.ezmetrology.com/wp-content/uploads/MEIP13005-SpeedPod-next-to-Power-Station_TH-1024x576.jpg)
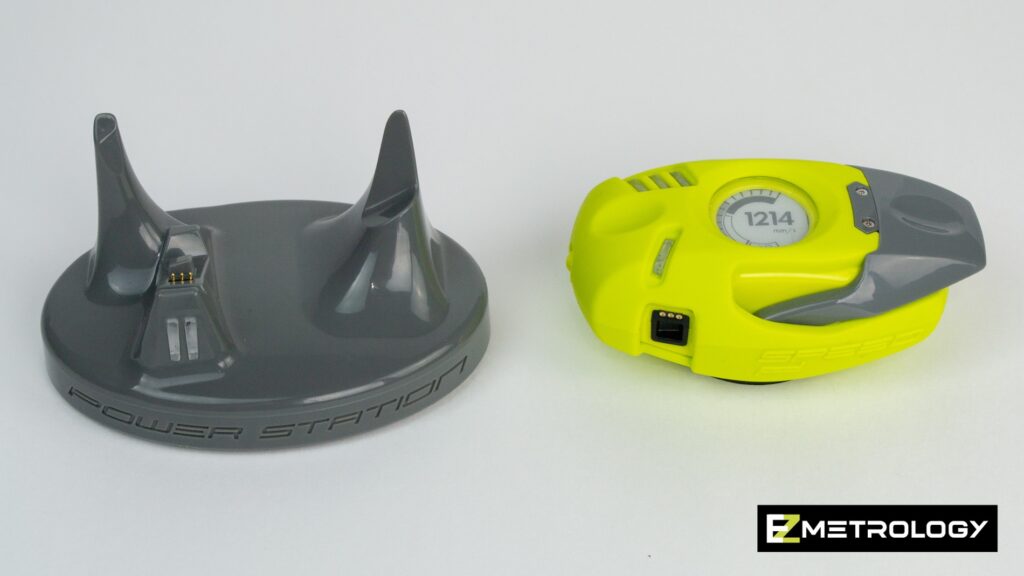
SpeedPod next to Power Station
Image of SpeedPod next to the Power Station unit used for charging
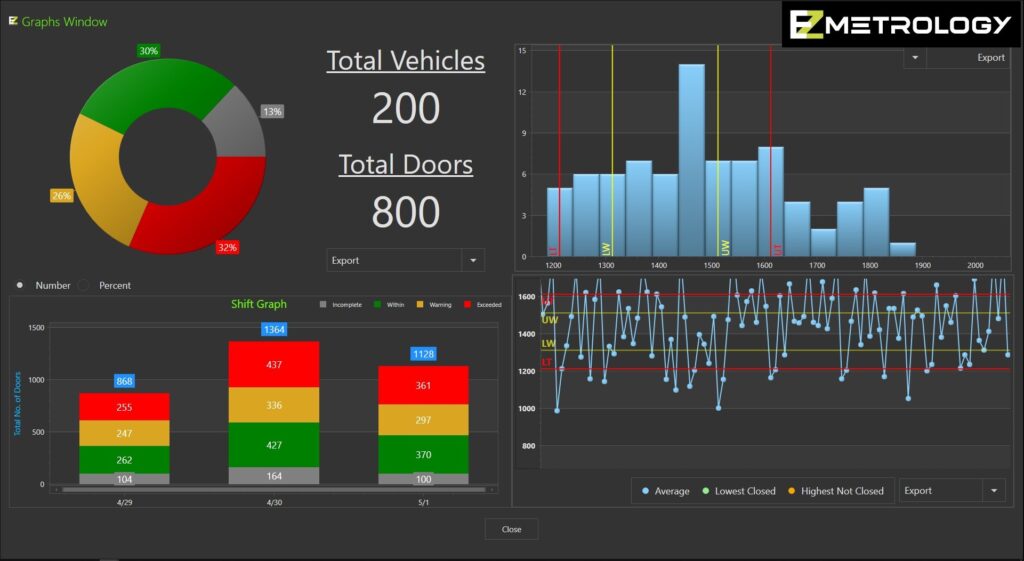
![](https://portal.ezmetrology.com/wp-content/uploads/MEIP14003-PLS-Graphs-Screen_TH-1024x561.jpg)
PLS Graphs Screen
Screenshot of graphs screen for PLS software
![](https://portal.ezmetrology.com/wp-content/uploads/MEIP14001-PLS-Flat-Screen-Offset-with-EZM-Logo_TH-1024x640.jpg)
PLS Flat Screen Offset with EZM Logo
Image of PLS used with EZSpeed on truck production line
![](https://portal.ezmetrology.com/wp-content/uploads/MEIP01007-EZSlamX-Software-Screenshot-of-Cabin-Pressure-Transient_TH-1024x576.jpg)
EZSlamX Software Screenshot of Cabin Pressure Transient
Screenshot of EZSlamX software illustrating sample measurement of door cabin pressure as car door is closed and cabin release valve opens
![](https://portal.ezmetrology.com/wp-content/uploads/MEIP01008-EZSlamX-Software-Close-Sweep-Force_TH-1024x626.jpg)
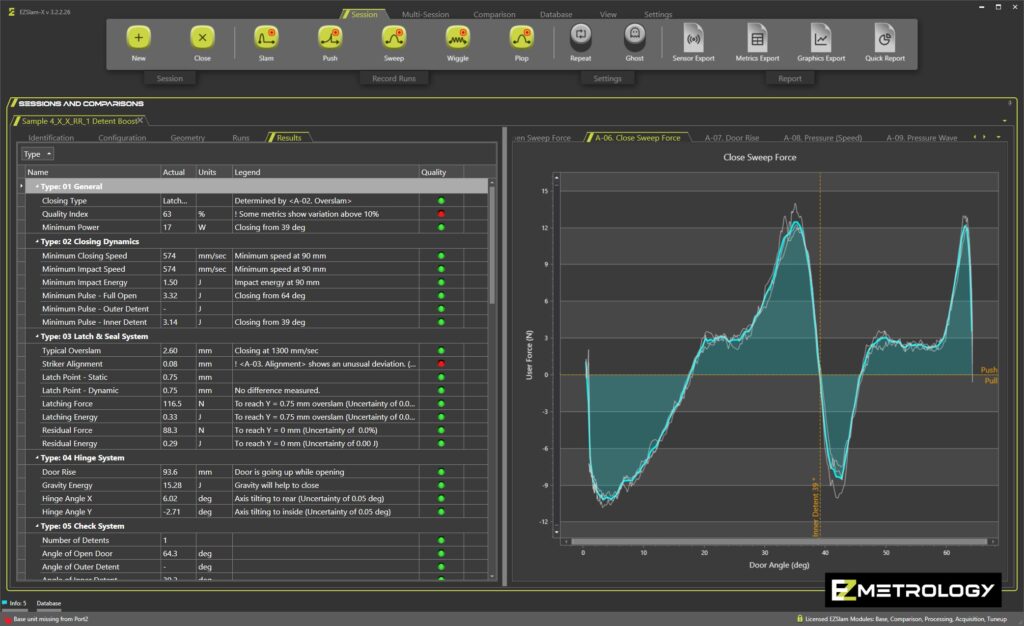
EZSlamX Software Close Sweep Force
Screenshot of EZSlamX software showing graphs for door closing sweep force
![](https://portal.ezmetrology.com/wp-content/uploads/MEIP01005-EZSlamX-Software-Speed-Trend-Charts-Only_TH-1024x626.jpg)
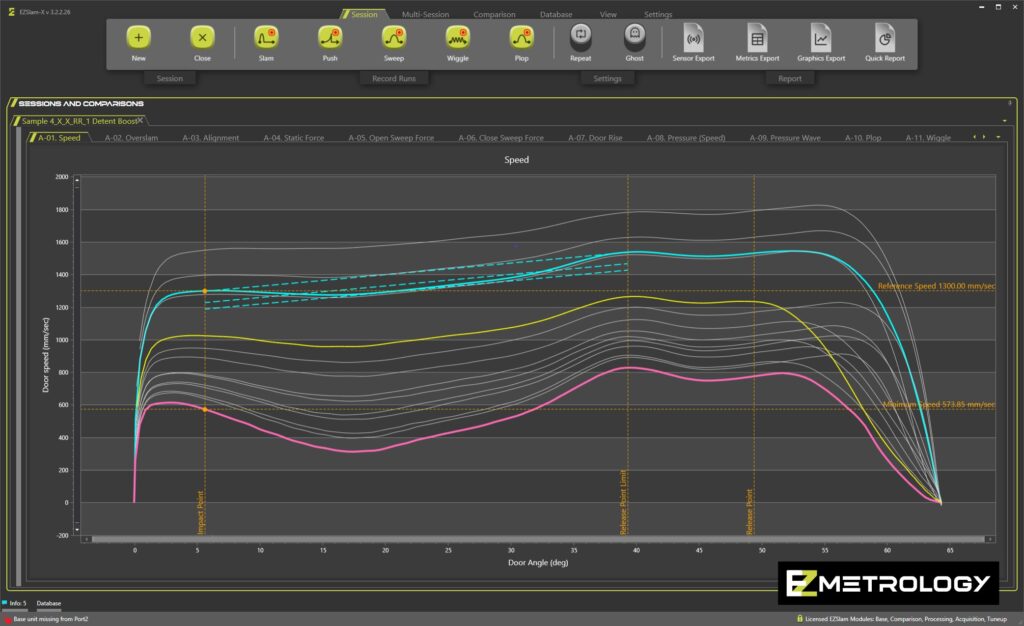
EZSlamX Software Speed Trend Charts Only
Screenshot of EZSlamX software showing trend charts for door closing speed analysis